

Question: Section: EX6#16-Ratio Analysis. Using the following data, calculate the Inventory Turnover, Days in Inventory, and Gross Profit Rate to 1 decimal place for fiscal years
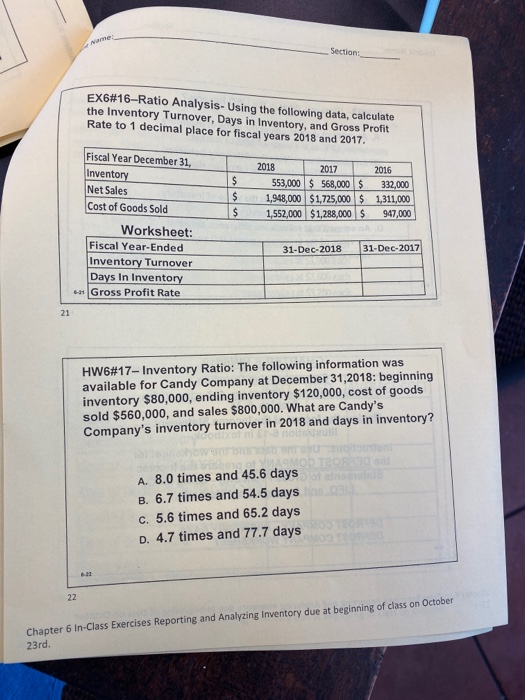
Section: EX6#16-Ratio Analysis. Using the following data, calculate the Inventory Turnover, Days in Inventory, and Gross Profit Rate to 1 decimal place for fiscal years 2018 and 2017. Fiscal Year December 31, Inventory Net Sales Cost of Goods Sold $ $ $ 2018 2017 553,000 $ 568,000 $ 1.948,000 $1,725,000 $ 1,552,000 $1,288,000 $ 2016 332,000 1,311,000 947,000 31-Dec-2018 31-Dec-2017 Worksheet: Fiscal Year-Ended Inventory Turnover Days In Inventory Gross Profit Rate HW6#17- Inventory Ratio: The following information was available for Candy Company at December 31,2018: beginning inventory $80,000, ending inventory $120,000, cost of goods sold $560,000, and sales $800,000. What are Candy's Company's inventory turnover in 2018 and days in inventory? A. 8.0 times and 45.6 days B. 6.7 times and 54.5 days c. 5.6 times and 65.2 days D. 4.7 times and 77.7 days Chapter 6 In-Class Exercises Reporting and Analyzing Inventory due at beginning of class on October 23rd
Step by Step Solution
There are 3 Steps involved in it

Get step-by-step solutions from verified subject matter experts