

Question: Section I: Marginal Revenues (MR) (20 points) Question 1: The following market is under perfect competition Demand = 60 - 20 and Supply = 15
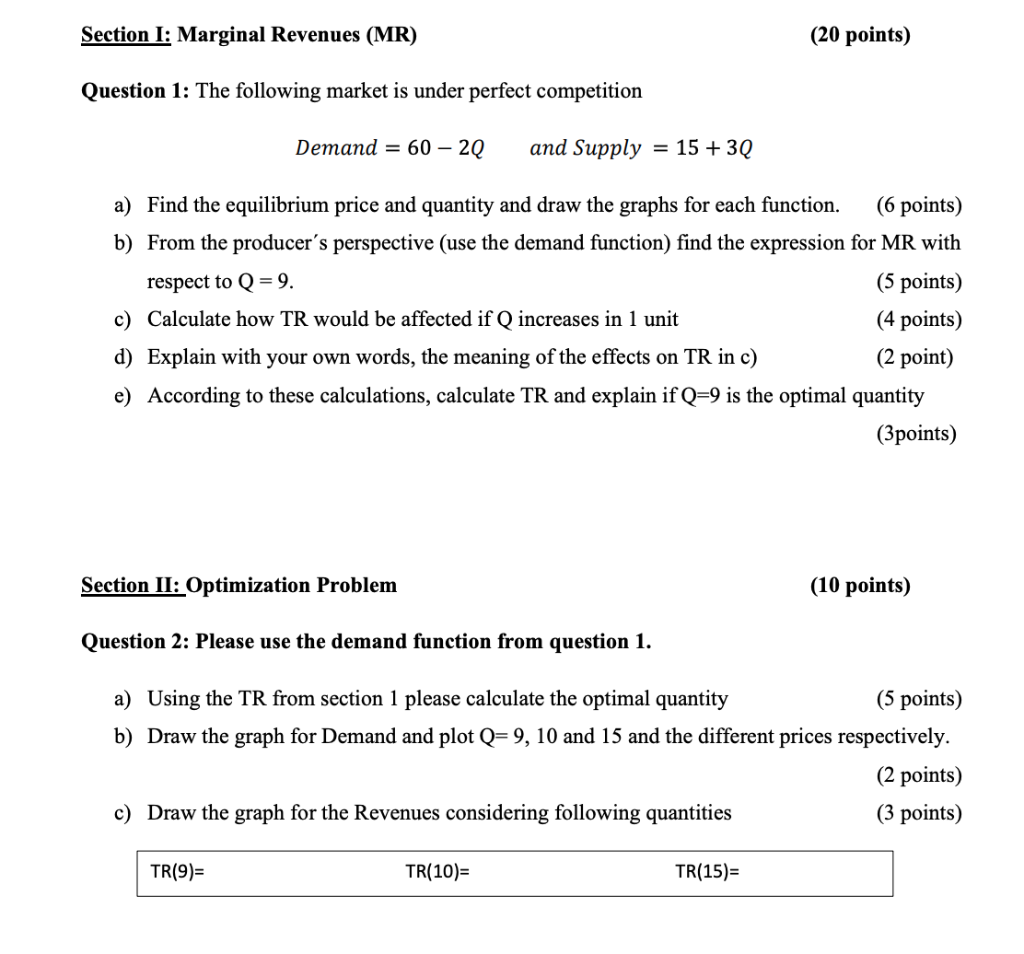
Section I: Marginal Revenues (MR) (20 points) Question 1: The following market is under perfect competition Demand = 60 - 20 and Supply = 15 + 3Q a) Find the equilibrium price and quantity and draw the graphs for each function. (6 points) b) From the producer's perspective (use the demand function) find the expression for MR with respect to Q = 9. (5 points) c) Calculate how TR would be affected if Q increases in 1 unit (4 points) d) Explain with your own words, the meaning of the effects on TR in c) (2 point) e) According to these calculations, calculate TR and explain if Q=9 is the optimal quantity (3points) Section II: Optimization Problem (10 points) Question 2: Please use the demand function from question 1. a) Using the TR from section 1 please calculate the optimal quantity (5 points) b) Draw the graph for Demand and plot Q=9, 10 and 15 and the different prices respectively. (2 points) c) Draw the graph for the Revenues considering following quantities (3 points) TR(9)= TR(10)= TR(15)= Section I: Marginal Revenues (MR) (20 points) Question 1: The following market is under perfect competition Demand = 60 - 20 and Supply = 15 + 3Q a) Find the equilibrium price and quantity and draw the graphs for each function. (6 points) b) From the producer's perspective (use the demand function) find the expression for MR with respect to Q = 9. (5 points) c) Calculate how TR would be affected if Q increases in 1 unit (4 points) d) Explain with your own words, the meaning of the effects on TR in c) (2 point) e) According to these calculations, calculate TR and explain if Q=9 is the optimal quantity (3points) Section II: Optimization Problem (10 points) Question 2: Please use the demand function from question 1. a) Using the TR from section 1 please calculate the optimal quantity (5 points) b) Draw the graph for Demand and plot Q=9, 10 and 15 and the different prices respectively. (2 points) c) Draw the graph for the Revenues considering following quantities (3 points) TR(9)= TR(10)= TR(15)=
Step by Step Solution
There are 3 Steps involved in it

Get step-by-step solutions from verified subject matter experts