

Question: Section II. House prices: 20 points; Tab 1 Case- Date Shiller CPI 01/01/2000 100.6 169.3 04/01/2006 206.7 200.7 Nominal Change 105.4% 18.5% Real change 73.30%
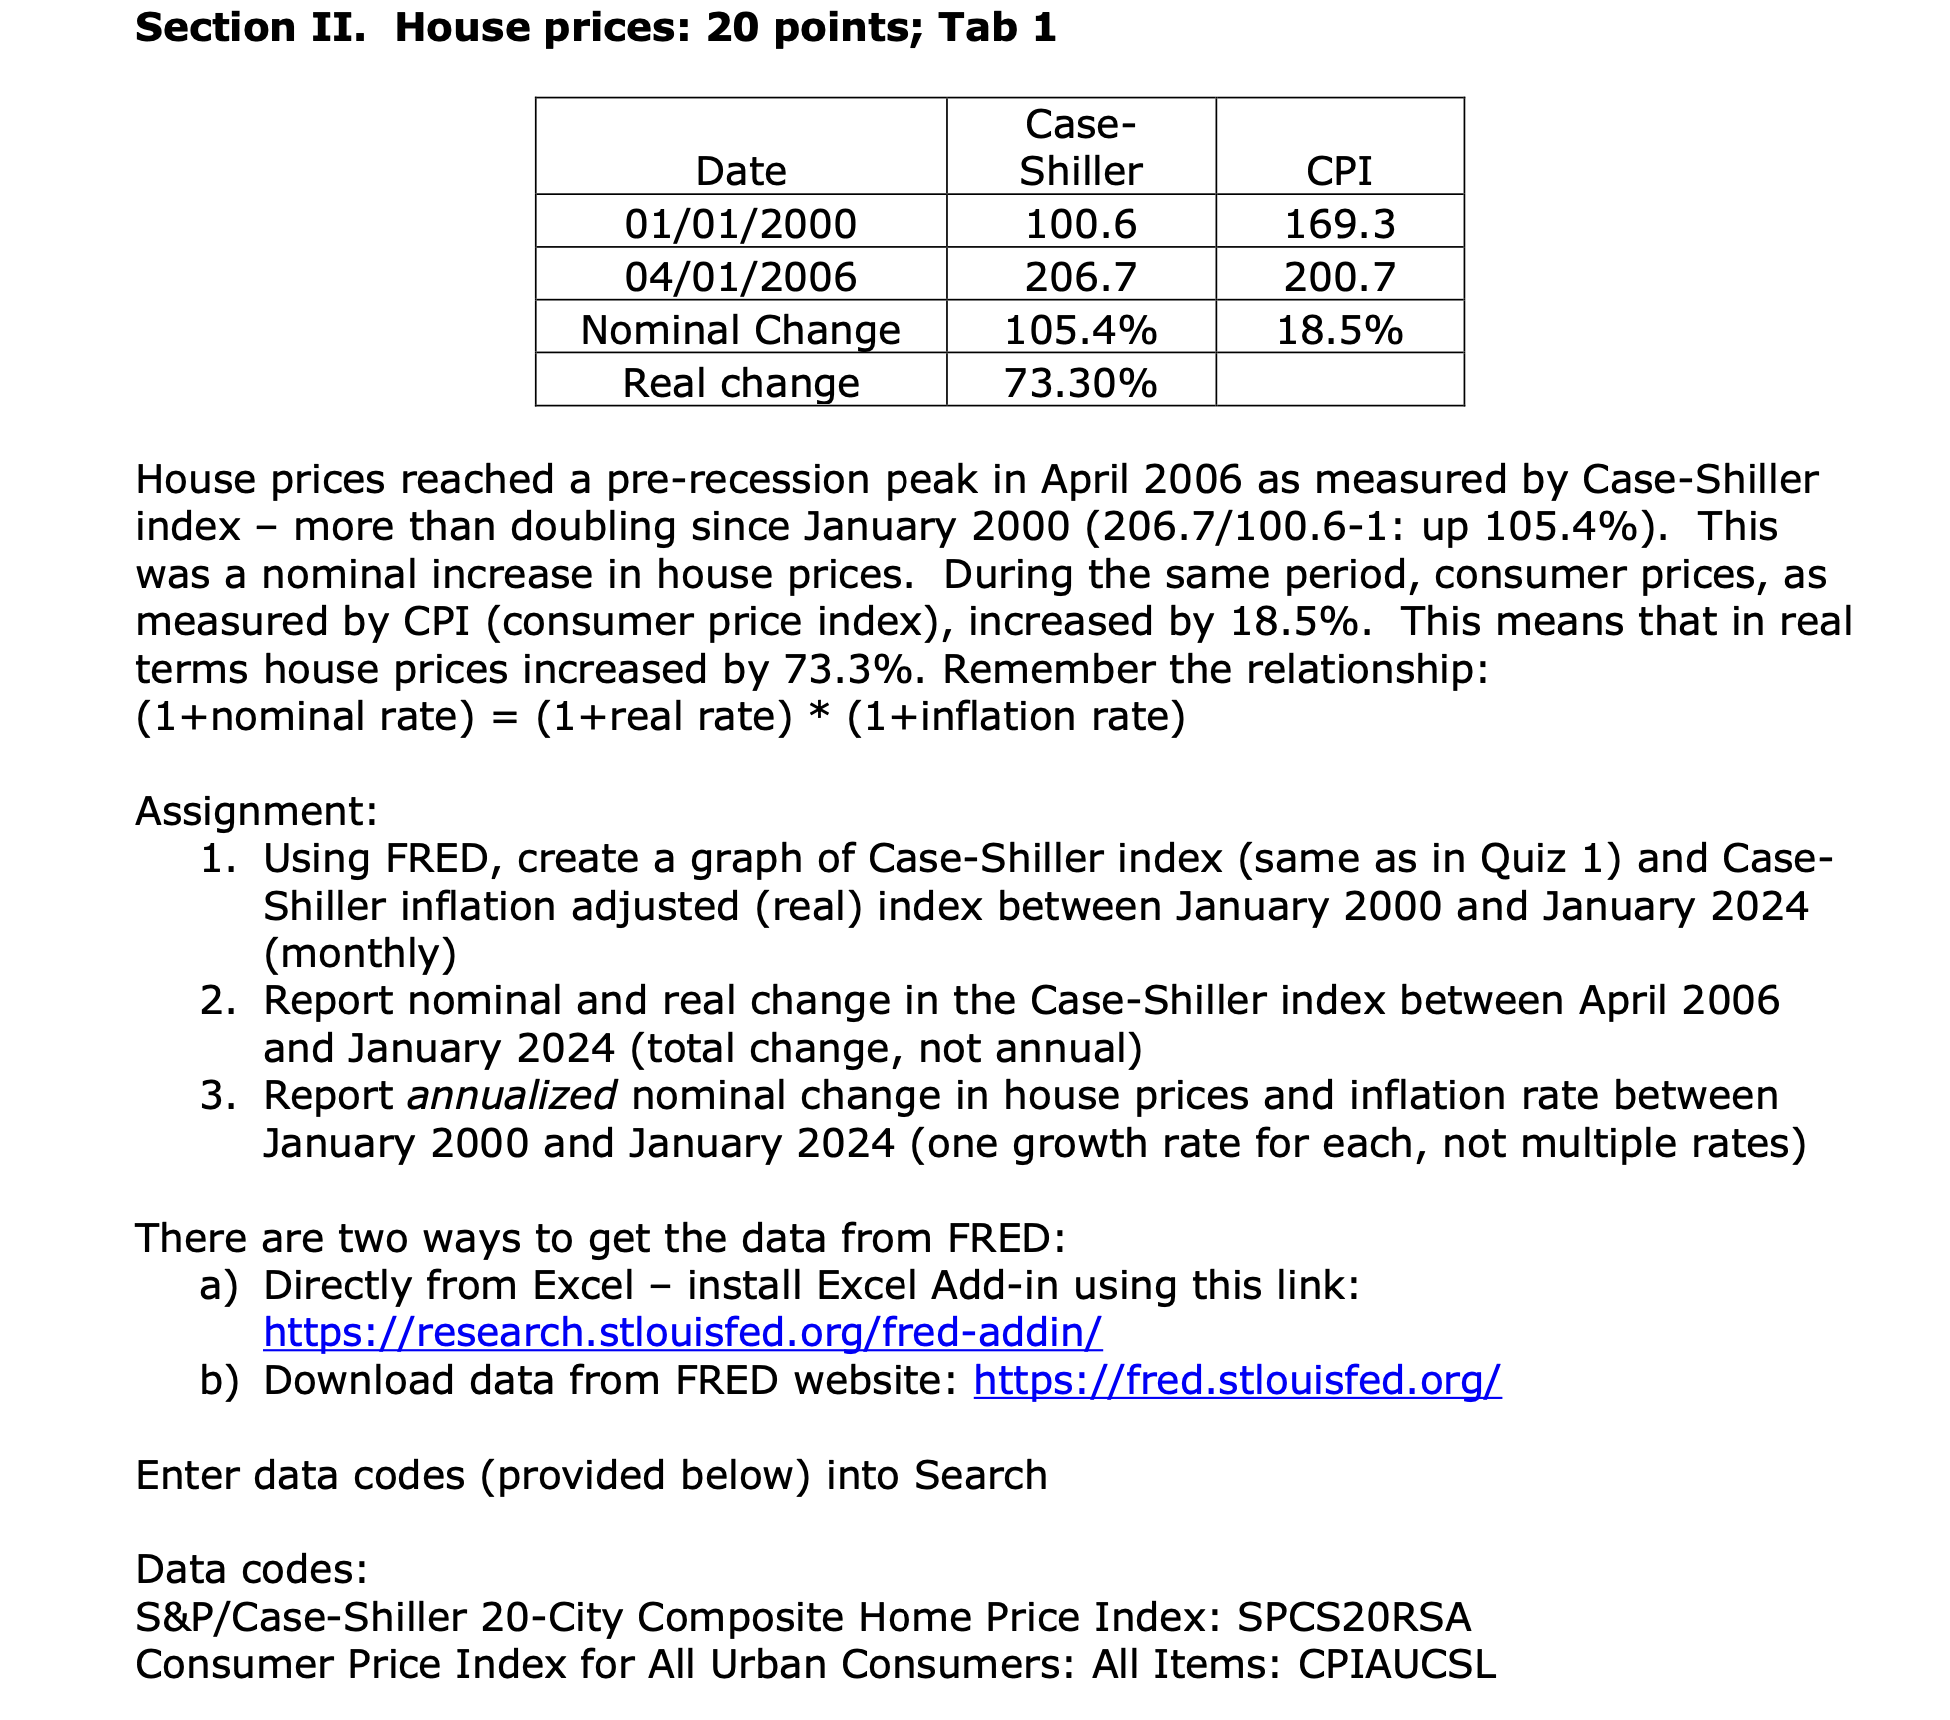
Section II. House prices: 20 points; Tab 1 Case- Date Shiller CPI 01/01/2000 100.6 169.3 04/01/2006 206.7 200.7 Nominal Change 105.4% 18.5% Real change 73.30% House prices reached a pre-recession peak in April 2006 as measured by Case-Shiller index - more than doubling since January 2000 (206.7/100.6-1: up 105.4%). This was a nominal increase in house prices. During the same period, consumer prices, as measured by CPI (consumer price index), increased by 18.5%. This means that in real terms house prices increased by 73.3%. Remember the relationship: (1+nominal rate) = (1+real rate) * (1+inflation rate) Assignment: 1. Using FRED, create a graph of Case-Shiller index (same as in Quiz 1) and Case- Shiller inflation adjusted (real) index between January 2000 and January 2024 (monthly) 2. Report nominal and real change in the Case-Shiller index between April 2006 and January 2024 (total change, not annual) 3. Report annualized nominal change in house prices and inflation rate between January 2000 and January 2024 (one growth rate for each, not multiple rates) There are two ways to get the data from FRED: a) Directly from Excel - install Excel Add-in using this link: https://research.stlouisfed. org/fred-addin/ b) Download data from FRED website: https://fred.stlouisfed.org/ Enter data codes (provided below) into Search Data codes: S&P/Case-Shiller 20-City Composite Home Price Index: SPCS20RSA Consumer Price Index for All Urban Consumers: All Items: CPIAUCSL
Step by Step Solution
There are 3 Steps involved in it

Get step-by-step solutions from verified subject matter experts