

Question: Section IV . SPC Analysis ( 4 0 points ) What SPC tools will you use to conduct this analysis Summary of the groups M&M
Section IV SPC Analysis points
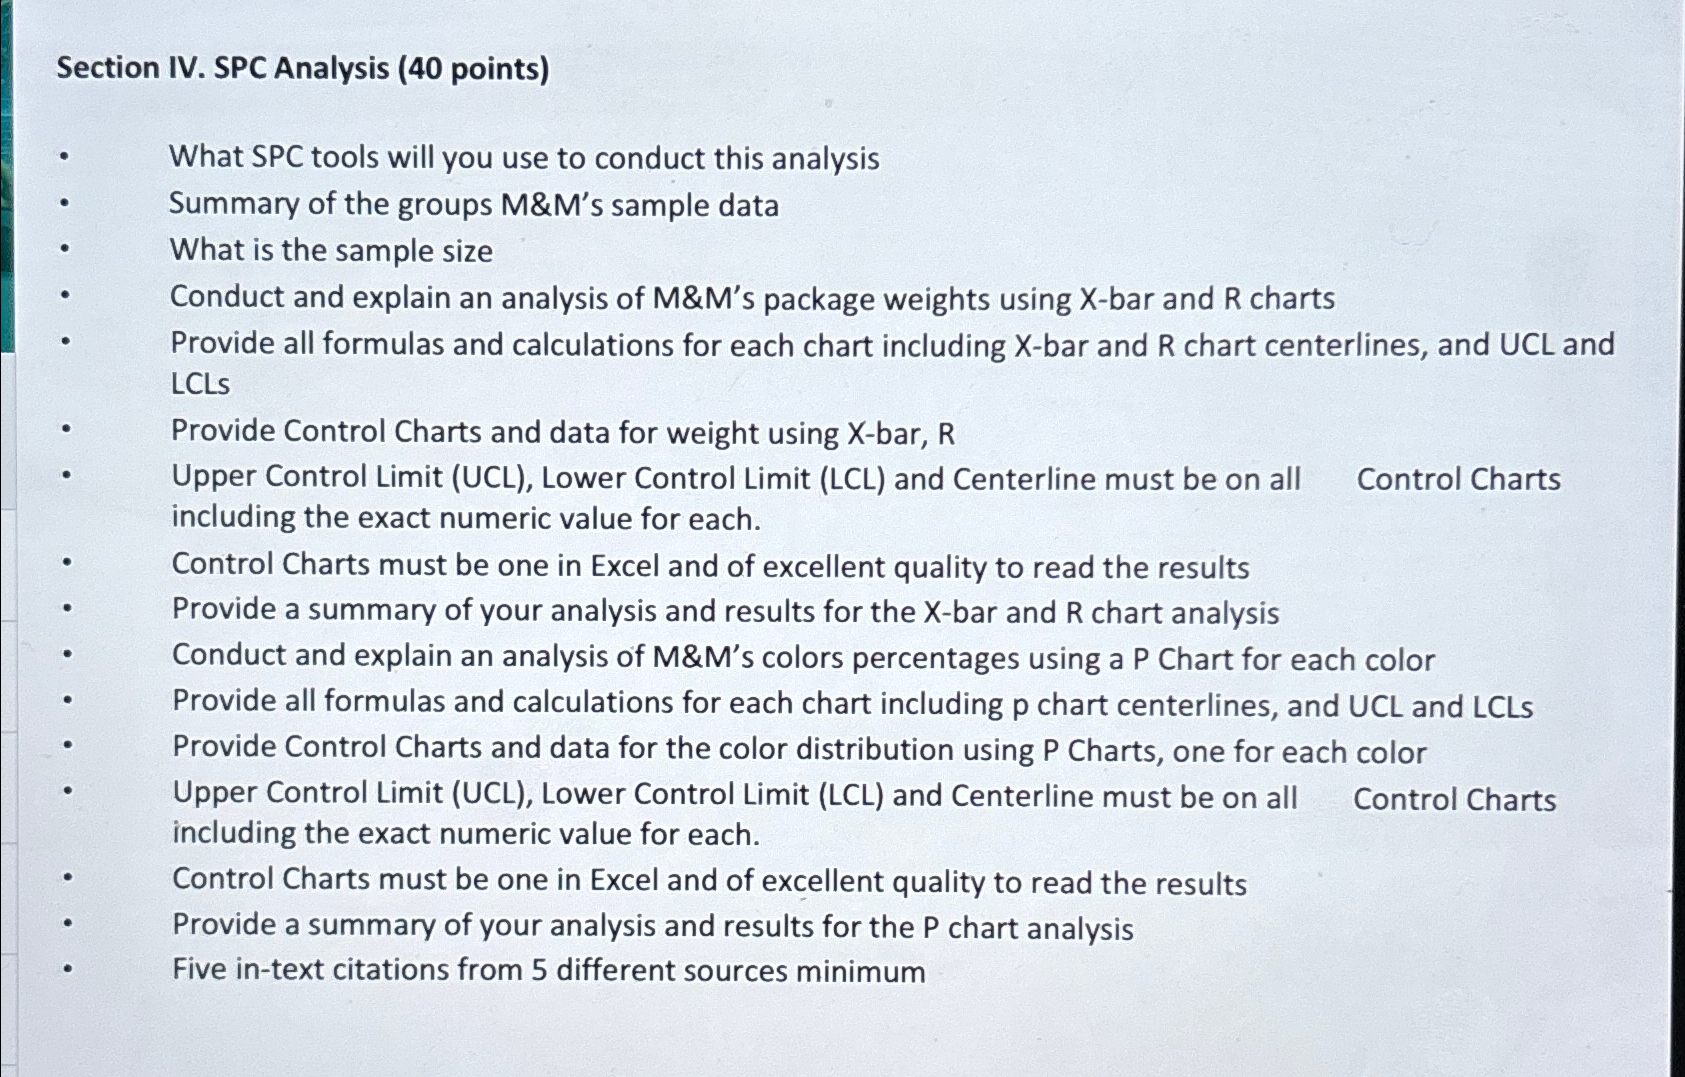
What SPC tools will you use to conduct this analysis
Summary of the groups M&Ms sample data
What is the sample size
Conduct and explain an analysis of M&Ms package weights using Xbar and charts
Provide all formulas and calculations for each chart including Xbar and R chart centerlines, and UCL and LCLS
Provide Control Charts and data for weight using Xbar,
Upper Control Limit UCL Lower Control Limit LCL and Centerline must be on all
Control Charts including the exact numeric value for each.
Control Charts must be one in Excel and of excellent quality to read the results
Provide a summary of your analysis and results for the Xbar and R chart analysis
Conduct and explain an analysis of M&Ms colors percentages using a P Chart for each color
Provide all formulas and calculations for each chart including p chart centerlines, and UCL and LCLS
Provide Control Charts and data for the color distribution using P Charts, one for each color
Upper Control Limit UCL Lower Control Limit LCL and Centerline must be on all Control Charts including the exact numeric value for each.
Control Charts must be one in Excel and of excellent quality to read the results
Provide a summary of your analysis and results for the chart analysis
Five intext citations from different sources minimum
Step by Step Solution
There are 3 Steps involved in it
1 Expert Approved Answer
Step: 1 Unlock

Question Has Been Solved by an Expert!
Get step-by-step solutions from verified subject matter experts
Step: 2 Unlock
Step: 3 Unlock