

Question: Section V . ( 2 3 pt . ) Wharton Econometric Forecasting, LLC has been hired to analyze demand in 3 0 regional markets for
Section Vpt
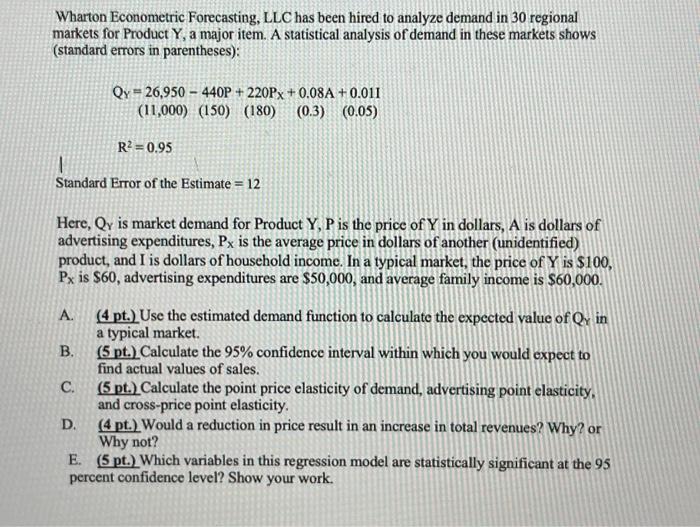
Wharton Econometric Forecasting, LLC has been hired to analyze demand in regional markets for Product Y a major item. A statistical analysis of demand in these markets shows standard errors in parentheses:
QY P PX A I
R
Standard Error of the Estimate
Here, QY is market demand for Product Y P is the price of Y in dollars, A is dollars of advertising expenditures, PX is the average price in dollars of another unidentified product, and I is dollars of household income. In a typical market, the price of Y is $ PX is $ advertising expenditures are $ and average family income is $
A pt Use the estimated demand function to calculate the expected value of QY in a typical market.
B pt Calculate the confidence interval within which you would expect to find actual values of sales.
C pt Calculate the point price elasticity of demand, advertising point elasticity, and crossprice point elasticity.
D pt Would a reduction in price result in an increase in total revenues? Why? or Why not?
E pt Which variables in this regression model are statistically significant at the percent confidence level? Show your work.
Step by Step Solution
There are 3 Steps involved in it
1 Expert Approved Answer
Step: 1 Unlock

Question Has Been Solved by an Expert!
Get step-by-step solutions from verified subject matter experts
Step: 2 Unlock
Step: 3 Unlock