

Question: Security Valuation Project Due date: April 30,2018 1. Go to and enter the ticker symbol for Intel Corporation (stock symbol: INTC) in the box just
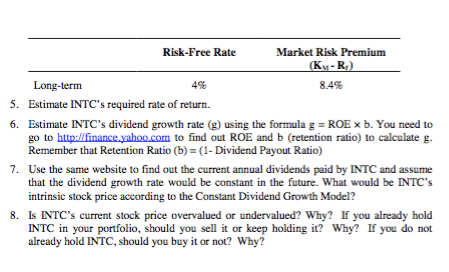
Security Valuation Project Due date: April 30,2018 1. Go to and enter the ticker symbol for Intel Corporation (stock symbol: INTC) in the box just below the Home and Investing tabs. After clicking the "Get Quotes" button, you will see very current information about this stock as well as a number of additional links to explore. Start by clicking "Historical Prices." At the top of the next page, you are given several choices about the time period over which you want to collect data. Select data from January 1, 2000, to April 15?2017. Also, select "weekly" to indicate that you seek weekly data. Next, click the link "Get Prices." You will then see a table containing weekly data for this company. The final column contains the "Adjusted Close," a price that reflects dividend payment, stock dividends, or stock splits. Click the link labeled "Download Spreadsheet Format" below the table, and save the file when prompted. This should save the data in a comma-delimited file (with the csv file extension), which you can open in Excel. 2. Do the same thing for SPY and save the data (SPY is the ticker symbol for S&P Depository Receipts, commonly called Spiders. We use SPY as the proxy for the market portfolio). Problems: 1. Calculate the weekly return on INTC by dividing the adjusted close in any particular week by the adjusted closing price the previous week and subtracting Calculate the weekly return on the SPY the same way. Paste the returns on the S&P and the returns on INTC into a single spreadsheet. (To do so, use the "Paste-Special-Values" sequence in Excel) Calculate the correlation coefficient between INTC returns and SPY returns. 2. 3. 4. You will run a regression in Excel using the returns on INTC as the dependent, or Y variable, and returns on the SPY as the independent, or X variable. You can use the data analysis function under the tools menu (you may have to first click "Add ins" under the tools menu and then check the box labeled Analysis Toolpak"). Click "Tools-Data Analysis Regression" to set up the regression. Type in the cell range containing INTC returns for the input Y range, and type in the cell range containing the SPY returns for the input X range. Leave all the other boxes unchecked, except the one that places the output in a new worksheet. You have just estimated INTC's beta, which is the coefficient of the X variable in the regression output. To proceed, you will need the information below Security Valuation Project Due date: April 30,2018 1. Go to and enter the ticker symbol for Intel Corporation (stock symbol: INTC) in the box just below the Home and Investing tabs. After clicking the "Get Quotes" button, you will see very current information about this stock as well as a number of additional links to explore. Start by clicking "Historical Prices." At the top of the next page, you are given several choices about the time period over which you want to collect data. Select data from January 1, 2000, to April 15?2017. Also, select "weekly" to indicate that you seek weekly data. Next, click the link "Get Prices." You will then see a table containing weekly data for this company. The final column contains the "Adjusted Close," a price that reflects dividend payment, stock dividends, or stock splits. Click the link labeled "Download Spreadsheet Format" below the table, and save the file when prompted. This should save the data in a comma-delimited file (with the csv file extension), which you can open in Excel. 2. Do the same thing for SPY and save the data (SPY is the ticker symbol for S&P Depository Receipts, commonly called Spiders. We use SPY as the proxy for the market portfolio). Problems: 1. Calculate the weekly return on INTC by dividing the adjusted close in any particular week by the adjusted closing price the previous week and subtracting Calculate the weekly return on the SPY the same way. Paste the returns on the S&P and the returns on INTC into a single spreadsheet. (To do so, use the "Paste-Special-Values" sequence in Excel) Calculate the correlation coefficient between INTC returns and SPY returns. 2. 3. 4. You will run a regression in Excel using the returns on INTC as the dependent, or Y variable, and returns on the SPY as the independent, or X variable. You can use the data analysis function under the tools menu (you may have to first click "Add ins" under the tools menu and then check the box labeled Analysis Toolpak"). Click "Tools-Data Analysis Regression" to set up the regression. Type in the cell range containing INTC returns for the input Y range, and type in the cell range containing the SPY returns for the input X range. Leave all the other boxes unchecked, except the one that places the output in a new worksheet. You have just estimated INTC's beta, which is the coefficient of the X variable in the regression output. To proceed, you will need the information below
Step by Step Solution
There are 3 Steps involved in it

Get step-by-step solutions from verified subject matter experts