

Question: (See attached image for supply and demand numbers)A) Consider the autarky scenario first. Sketch the supply and demand curves, with the appropriate labeling for the

(See attached image for supply and demand numbers)A) Consider the autarky scenario first. Sketch the supply and demand curves, with the appropriate labeling for the equilibrium point, surplus regions.B) Report the coordinates of the equilibrium point, which represent the price and quantity the market operates at.C) Calculate the consumer and producer surplus values under autarky. What is total welfare for the economy?Suppose Home opens up to free-trade, and becomes exposed to a world price, Pw = 25.D) Re-sketch the market with the new price line and corresponding equilibria points for quantity demanded and supplied. Calculate the equilibrium values for quantities, imports and surplus values. Highlight the change in welfare, relative to autarky.Consider a case in which the government intervenes, setting a tariff rate of t = 4.E) Sketch the updated demand & supply schedule. Upon appropriate labeling the diagram, highlight which regions are the e?iciency and deadweight loss areas, respectively.6) Calculate the equilibria for quantity supplied, quantity demanded, imports and surpluses (consumer, producer, government). Find the change in welfare, relative to free-trade.
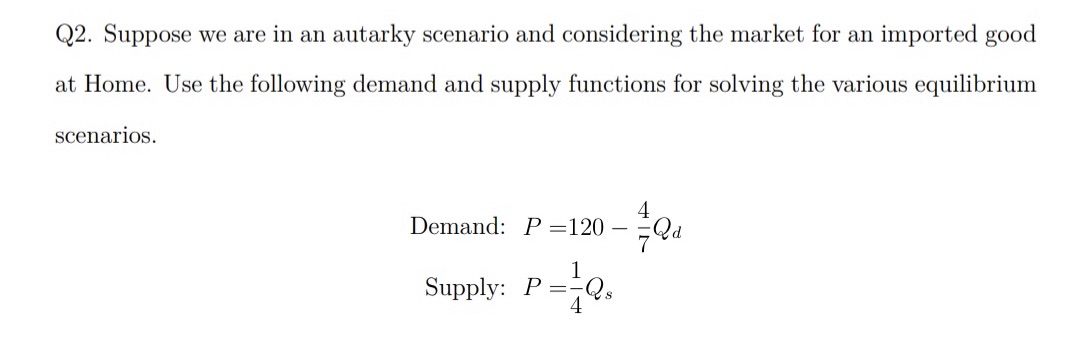
Q2. Suppose We are in an autarky Scenario and considering the market for an imported good at Home. Use the following demand and supply functions for solving the various equilibrium scenarios. Demand: P =120 :Qd 1 SUDplyr P =16}
Step by Step Solution
There are 3 Steps involved in it

Get step-by-step solutions from verified subject matter experts