

Question: See attached please: PSY205 | Amanda C. Egan, Ph.D. | Marian University Indianapolis PSY205: CH. 9 WORKSHEET Computing a One-Sample T-Test Show your work for
See attached please:
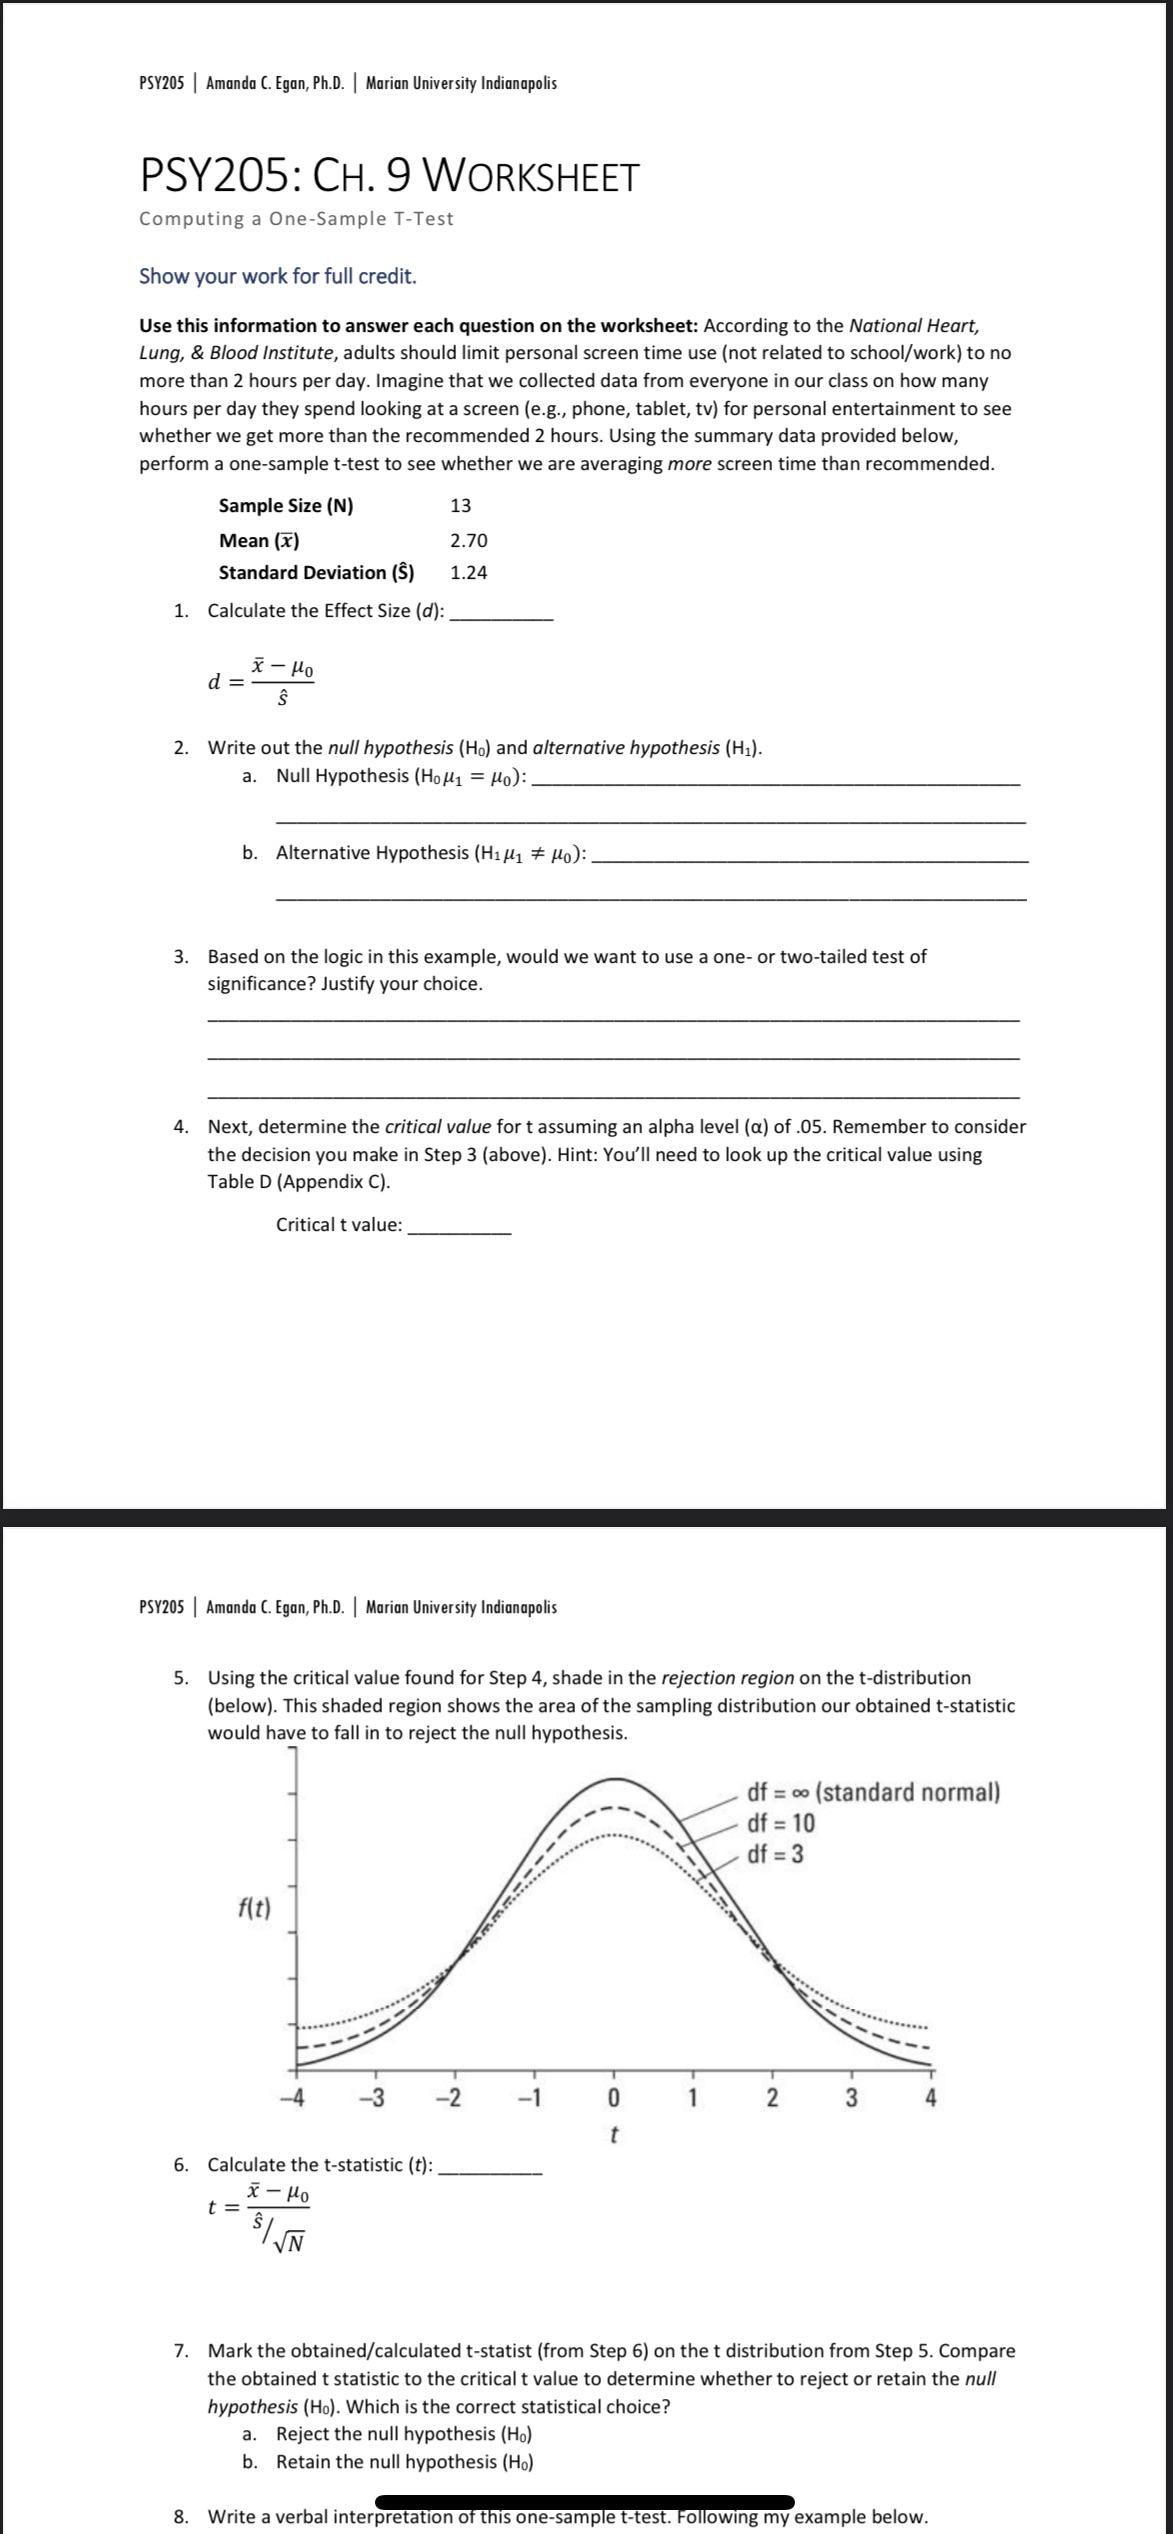
PSY205 | Amanda C. Egan, Ph.D. | Marian University Indianapolis PSY205: CH. 9 WORKSHEET Computing a One-Sample T-Test Show your work for full credit. Use this information to answer each question on the worksheet: According to the National Heart, Lung, & Blood Institute, adults should limit personal screen time use (not related to school/work) to no more than 2 hours per day. Imagine that we collected data from everyone in our class on how many hours per day they spend looking at a screen (e.g., phone, tablet, tv) for personal entertainment to see whether we get more than the recommended 2 hours. Using the summary data provided below, perform a one-sample t-test to see whether we are averaging more screen time than recommended. Sample Size (N) 13 Mean (x) 2.70 Standard Deviation (S) 1.24 1. Calculate the Effect Size (d): x - Ho d = - 2. Write out the null hypothesis (Ho) and alternative hypothesis (H1). a. Null Hypothesis (Hol1 = Ho): b. Alternative Hypothesis (Hill] # Ho): 3. Based on the logic in this example, would we want to use a one- or two-tailed test of significance? Justify your choice. 4. Next, determine the critical value for t assuming an alpha level (a) of .05. Remember to consider the decision you make in Step 3 (above). Hint: You'll need to look up the critical value using Table D (Appendix C). Critical t value: PSY205 | Amanda C. Egan, Ph.D. | Marian University Indianapolis 5. Using the critical value found for Step 4, shade in the rejection region on the t-distribution (below). This shaded region shows the area of the sampling distribution our obtained t-statistic would have to fall in to reject the null hypothesis. df = 0. (standard normal) df = 10 df = 3 f(t) -2 -1 2 6. Calculate the t-statistic (t): t = x - Ho 7. Mark the obtained/calculated t-statist (from Step 6) on the t distribution from Step 5. Compare the obtained t statistic to the critical t value to determine whether to reject or retain the null hypothesis (Ho). Which is the correct statistical choice? a. Reject the null hypothesis (Ho) b. Retain the null hypothesis (Ho) 8. Write a verbal interpretation of this one-sample t-test. Following my example below
Step by Step Solution
There are 3 Steps involved in it

Get step-by-step solutions from verified subject matter experts