

Question: see attached The statistics below shows the full time equivalent student (FTES) count for the history of Lake Tahoe Community College. . H = 1,000
see attached
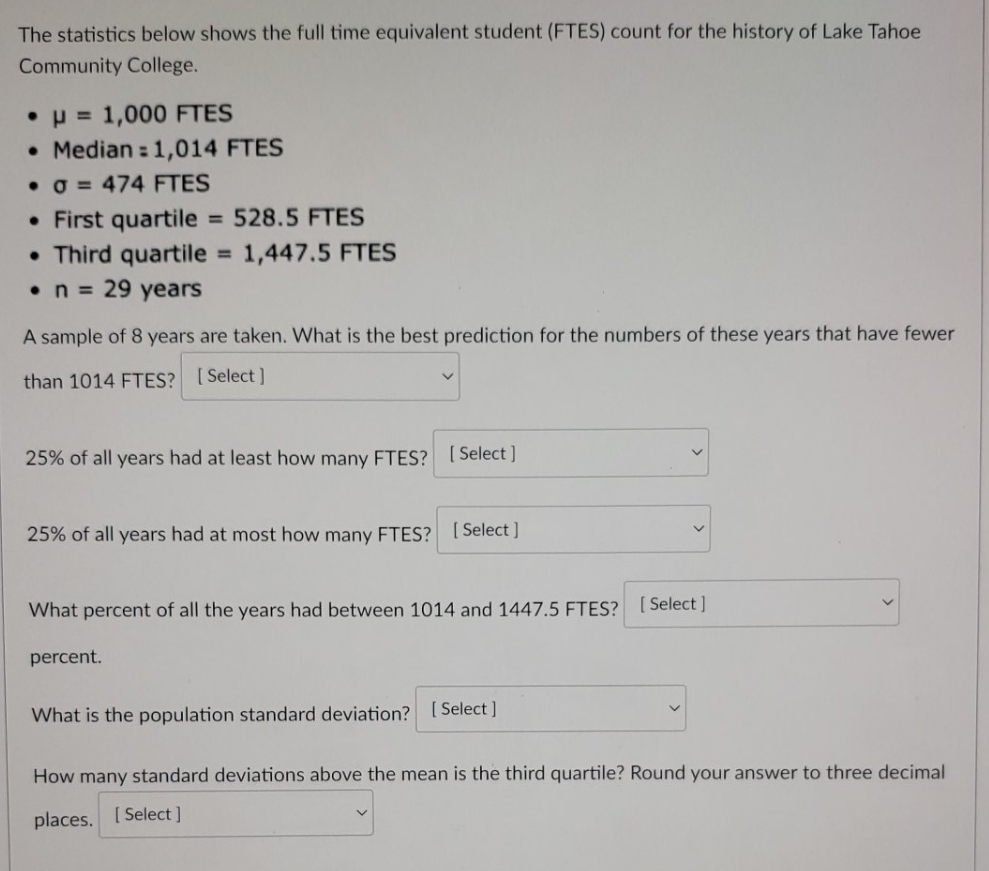
The statistics below shows the full time equivalent student (FTES) count for the history of Lake Tahoe Community College. . H = 1,000 FTES . Median = 1,014 FTES . 0 = 474 FTES . First quartile = 528.5 FTES . Third quartile = 1,447.5 FTES . n = 29 years A sample of 8 years are taken. What is the best prediction for the numbers of these years that have fewer than 1014 FTES? [ Select ] 25% of all years had at least how many FTES? [ Select ] 25% of all years had at most how many FTES? [ Select ] What percent of all the years had between 1014 and 1447.5 FTES? [ Select ] percent. What is the population standard deviation? [ Select ] How many standard deviations above the mean is the third quartile? Round your answer to three decimal places. [ Select ]
Step by Step Solution
There are 3 Steps involved in it

Get step-by-step solutions from verified subject matter experts