

Question: See below for the R Studio code questions. Please Help! G . Rerun the code from C and E above to check that all missing
See below for the R Studio code questions. Please Help! G Rerun the code from C and E above to check that all missing data have been fixed.
r
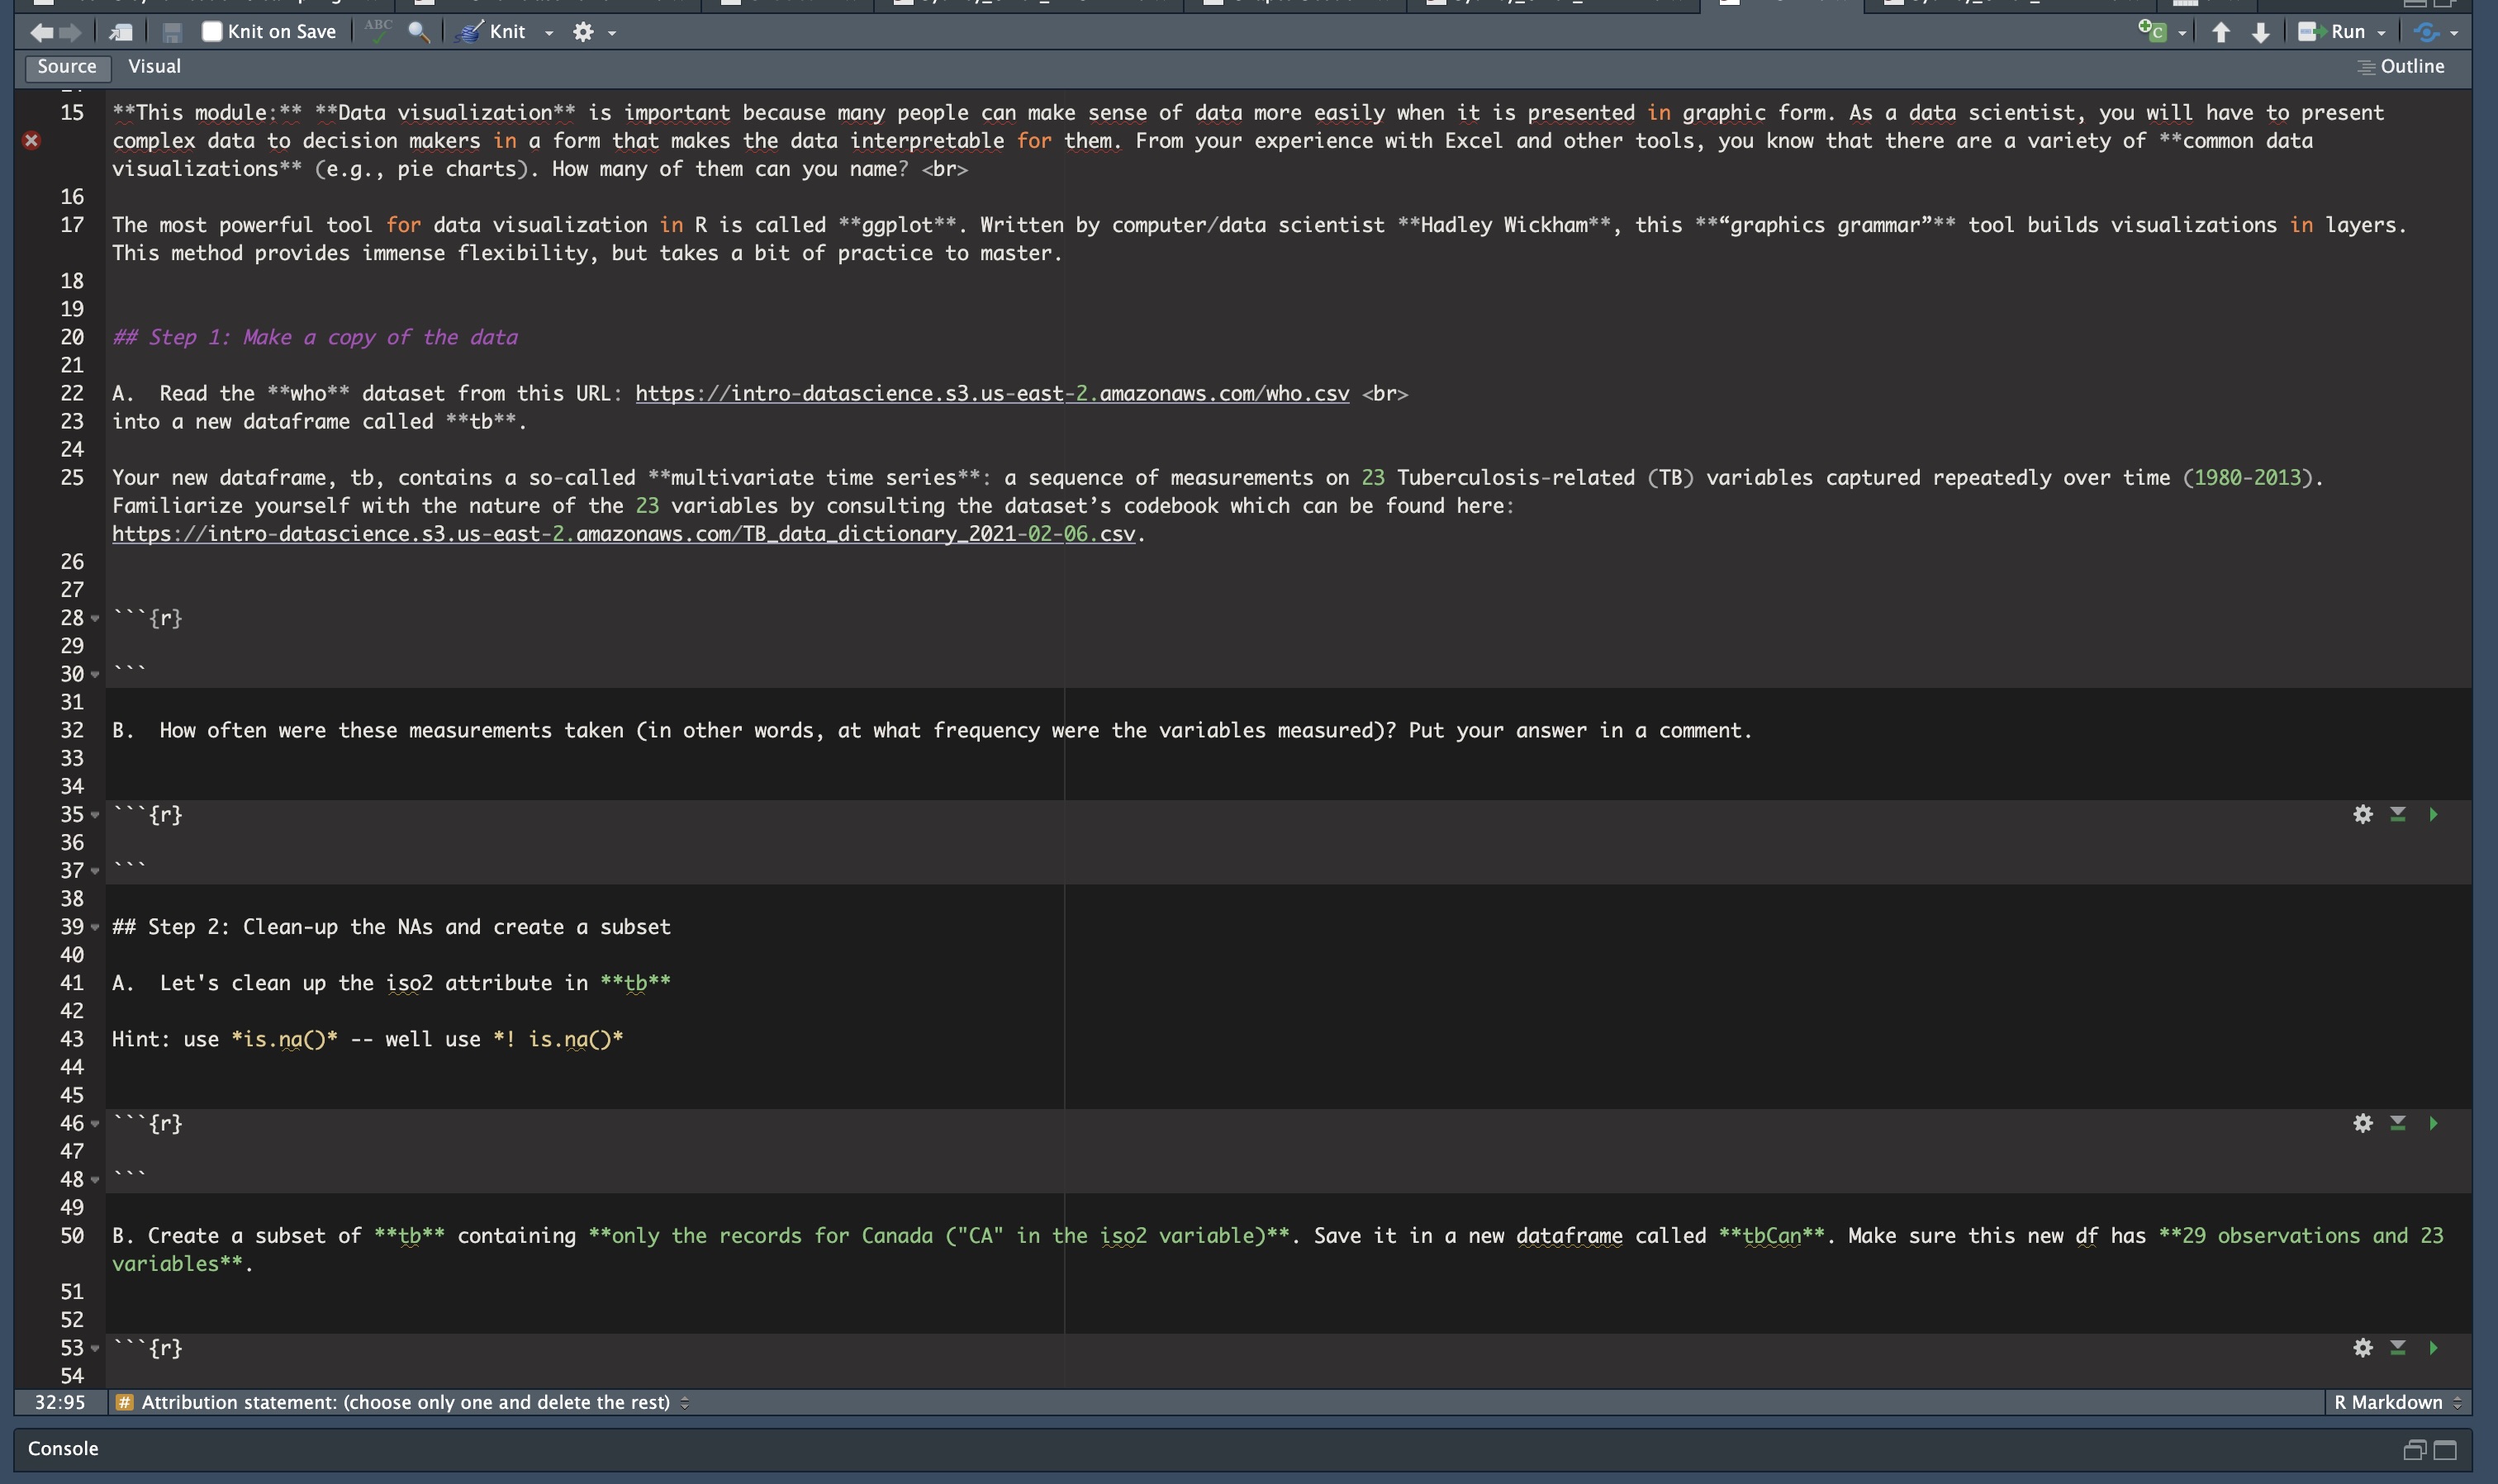
## Step : Use ggplot to explore the distribution of each variable
Dont forget to install and library the ggplot package. Then:
H Create a histogram for newspm Be sure to add a title and briefly describe what the histogram means in a comment.
I. Create histograms using ggplot of each of the other three variables from E with ggplot
Which parameter do you need to adjust to make the other histograms look right?
r
cdot
## Step : Explore how the data changes over time and newspm on the Yaxis.
r
cdot
K Next, create similar graphs for each of the other three variables. Change the color of the line plots any color you want
r
among citizens years of age and older and save the resulting vector in the tbCan variable called newspcombined
Step by Step Solution
There are 3 Steps involved in it
1 Expert Approved Answer
Step: 1 Unlock

Question Has Been Solved by an Expert!
Get step-by-step solutions from verified subject matter experts
Step: 2 Unlock
Step: 3 Unlock