

Question: See below image for Boeing's current stock information. 1. Using that info, determine expected price using the Free Cash Flow Model. 2. Using that info,
See below image for Boeing's current stock information.
1. Using that info, determine expected price using the Free Cash Flow Model.
2. Using that info, determine expected price using the Constant Growth Dividend Model. Please show all calculations/work for both #1 and #2.
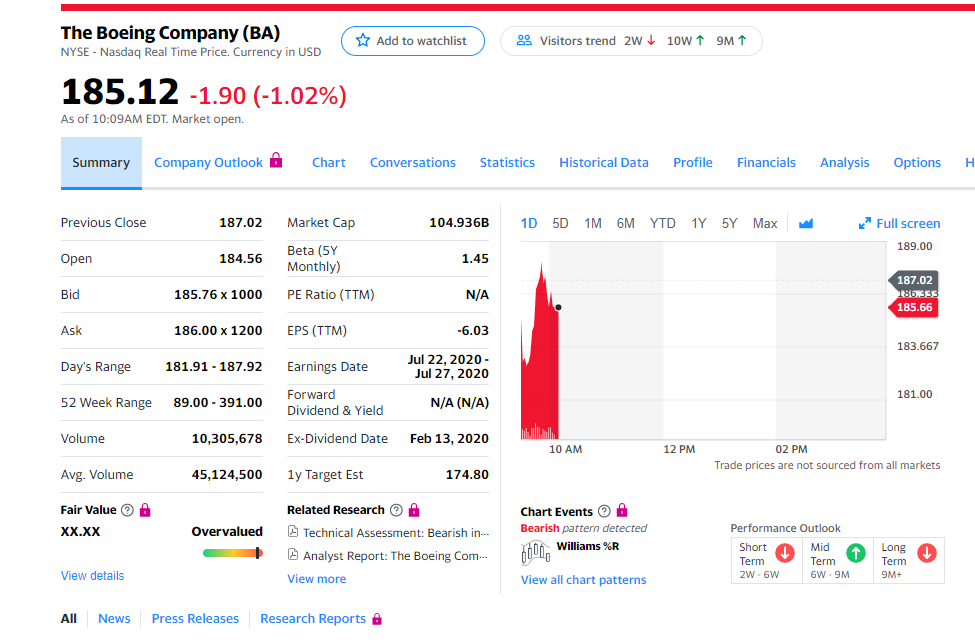
The Boeing Company (BA) NYSE - Nasdaq Real Time Price. Currency in USD * Add to watchlist 29 Visitors trend 2w10w1 9M 1 185.12 -1.90 (-1.02%) As of 10:09AM EDT. Market open. Summary Company Outlook Chart Conversations Statistics Historical Data Profile Financials Analysis Options H Previous Close 187.02 Market Cap 104.936B 1D 5D 1M 6M YTD 1Y 5Y Max Full screen 189.00 Open 184.56 Beta (5Y Monthly) 1.45 Bid 185.76 x 1000 PE Ratio (TTM) N/A 187.02 186.555 185.66 Ask 186.00 x 1200 EPS (TTM) -6.03 183.667 Day's Range 181.91 - 187.92 Earnings Date Jul 22, 2020- Jul 27, 2020 181.00 52 Week Range Forward Dividend & Yield 89.00 - 391.00 N/A (N/A) Volume 10,305,678 Ex-Dividend Date Feb 13, 2020 10 AM 12 PM 02 PM Trade prices are not sourced from all markets Avg. Volume 45,124,500 1y Target Est 174.80 Fair Value 0 XX.XX Overvalued Related Research A Technical Assessment: Bearish in... Analyst Report: The Boeing Com... View more Chart Events & Bearish pattern detected Williams %R Performance Outlook Short Mid Term Term 2W6W 6W - 9M o Long Term 9M+ View details View all chart patterns All News Press Releases Research Reports The Boeing Company (BA) NYSE - Nasdaq Real Time Price. Currency in USD * Add to watchlist 29 Visitors trend 2w10w1 9M 1 185.12 -1.90 (-1.02%) As of 10:09AM EDT. Market open. Summary Company Outlook Chart Conversations Statistics Historical Data Profile Financials Analysis Options H Previous Close 187.02 Market Cap 104.936B 1D 5D 1M 6M YTD 1Y 5Y Max Full screen 189.00 Open 184.56 Beta (5Y Monthly) 1.45 Bid 185.76 x 1000 PE Ratio (TTM) N/A 187.02 186.555 185.66 Ask 186.00 x 1200 EPS (TTM) -6.03 183.667 Day's Range 181.91 - 187.92 Earnings Date Jul 22, 2020- Jul 27, 2020 181.00 52 Week Range Forward Dividend & Yield 89.00 - 391.00 N/A (N/A) Volume 10,305,678 Ex-Dividend Date Feb 13, 2020 10 AM 12 PM 02 PM Trade prices are not sourced from all markets Avg. Volume 45,124,500 1y Target Est 174.80 Fair Value 0 XX.XX Overvalued Related Research A Technical Assessment: Bearish in... Analyst Report: The Boeing Com... View more Chart Events & Bearish pattern detected Williams %R Performance Outlook Short Mid Term Term 2W6W 6W - 9M o Long Term 9M+ View details View all chart patterns All News Press Releases Research Reports
Step by Step Solution
There are 3 Steps involved in it

Get step-by-step solutions from verified subject matter experts