

Question: see image 6. (28) Consider a consumer a whose income, Y, and consumption, 0, both measured in dollars, both depend on her age. All variables
see image
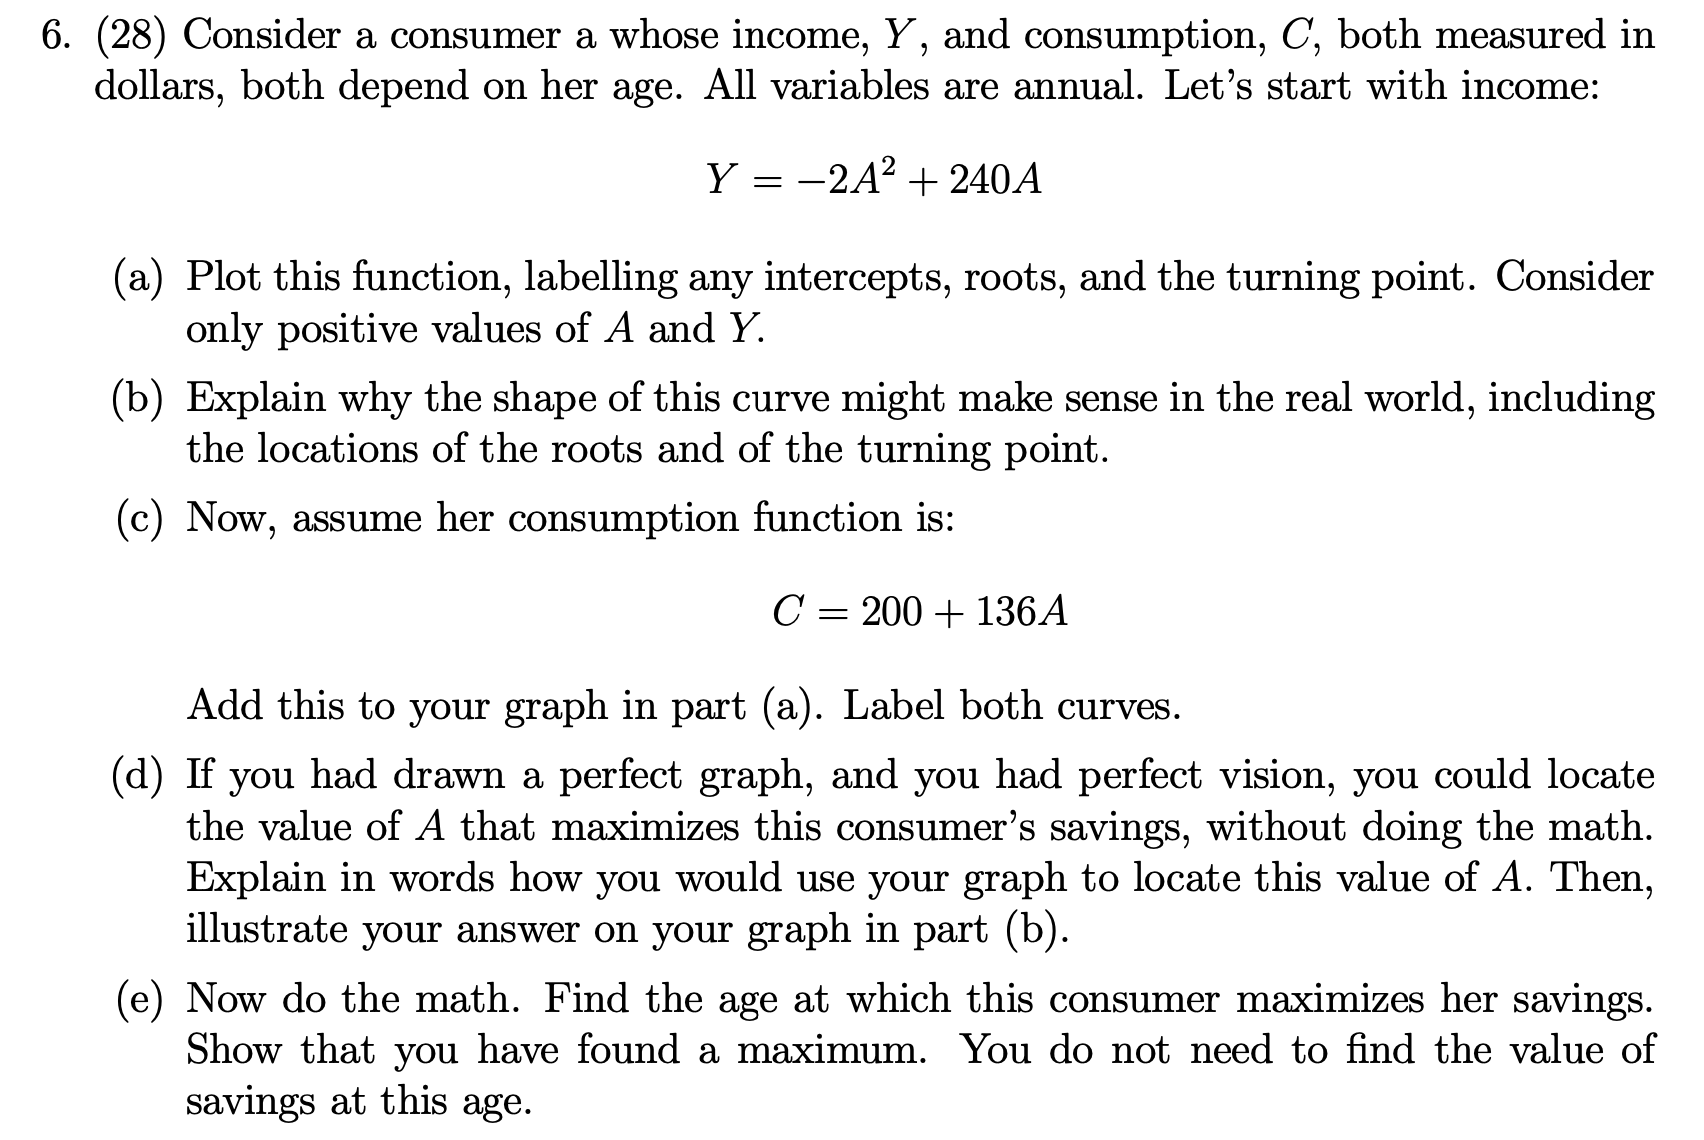
6. (28) Consider a consumer a whose income, Y, and consumption, 0, both measured in dollars, both depend on her age. All variables are annual. Let's start with income: Y = 2A2 + 240A (a) Plot this function, labelling any intercepts, roots, and the turning point. Consider only positive values of A and Y. (b) Explain why the shape of this curve might make sense in the real world, including the locations of the roots and of the turning point. (c) Now, assume her consumption function is: C = 200 + 136.4 Add this to your graph in part (a). Label both curves. (d) If you had drawn a perfect graph, and you had perfect vision, you could locate the value of A that maximizes this consumer's savings, without doing the math. Explain in words how you would use your graph to locate this value of A. Then, illustrate your answer on your graph in part (b). (e) Now do the math. Find the age at which this consumer maximizes her savings. Show that you have found a maximum. You do not need to nd the value of savings at this age
Step by Step Solution
There are 3 Steps involved in it

Get step-by-step solutions from verified subject matter experts