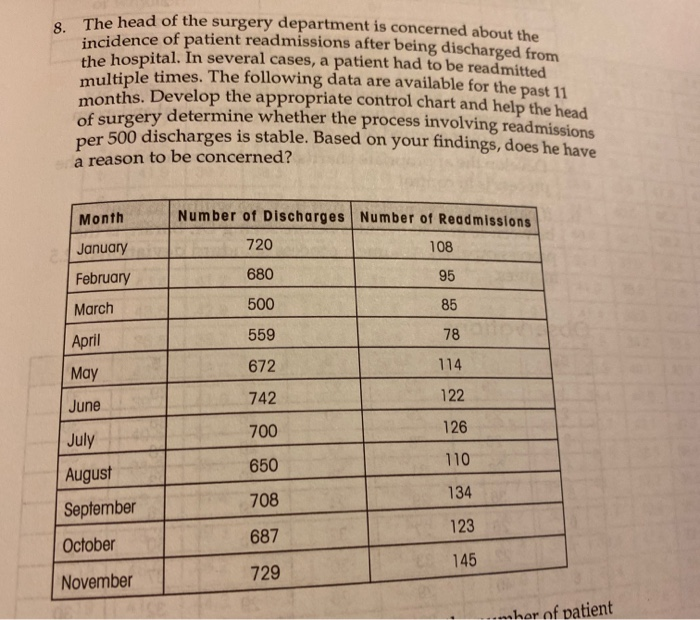
Question: See pictures below. Please explain each step n u u-bar Su LCLU UCLU 1 M2-Q5 (Textbook Problem 8 Chapter 5) 2 3 Discharge rate 500.0

See pictures below. Please explain each step See pictures below. Please explain each step n u
See pictures below. Please explain each step n u
n u u-bar Su LCLU UCLU 1 M2-Q5 (Textbook Problem 8 Chapter 5) 2 3 Discharge rate 500.0 Number of Number of Month 4 discharges readmissions 5 January 720 108 6 February 680 95 7 March 500 85 8 April 559 78 9 May 672 114 10 June 742 122 11 July 12 August 650 110 13 September 708 134 14 October 687 123 15 November 729 145 16 Sum 17 18 u-bar 19 20 21 22 700 126 8. The head of the surgery department is concerned about the incidence of patient readmissions after being discharged from the hospital. In several cases, a patient had to be readmitted multiple times. The following data are available for the past 11 months. Develop the appropriate control chart and help the head of surgery determine whether the process involving readmissions per 500 discharges is stable. Based on your findings, does he have a reason to be concerned? Month January Number of Discharges Number of Readmissions 720 108 680 95 February March 500 85 April 559 78 May 672 114 June 742 122 700 126 650 110 July August September October 134 708 123 687 145 729 November shor of patient

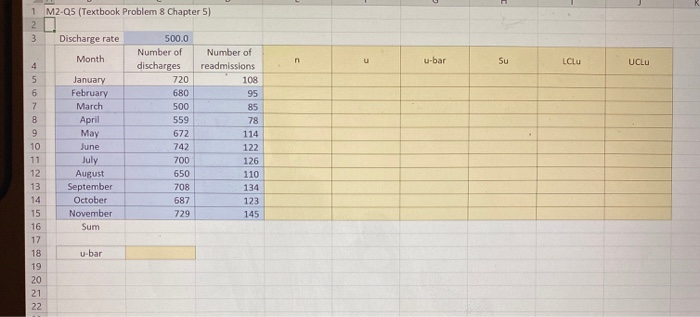
Step by Step Solution

There are 3 Steps involved in it

1 Expert Approved Answer
Step: 1 Unlock blur-text-image
Question Has Been Solved by an Expert!

Get step-by-step solutions from verified subject matter experts

Step: 2 Unlock
Step: 3 Unlock

Students Have Also Explored These Related General Management Questions!