

Question: See Table 2.5 ' showing financial statement data and stock price data for Mydeco Corp. a. By what percentage did Mydeco's revenues grow each year
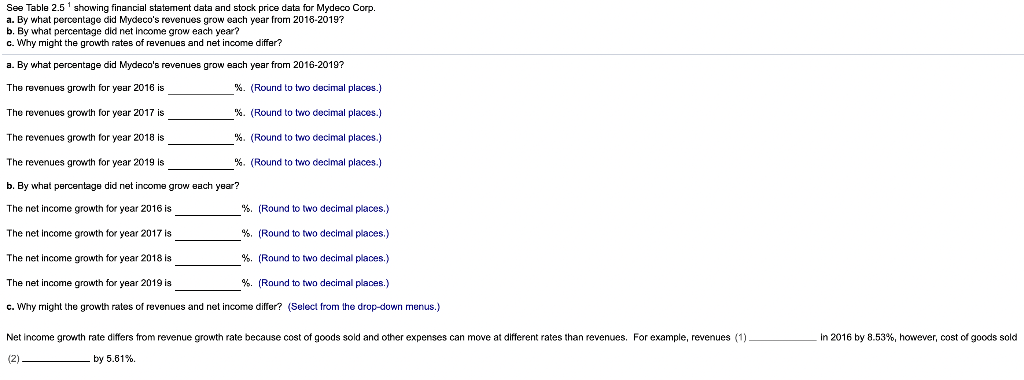
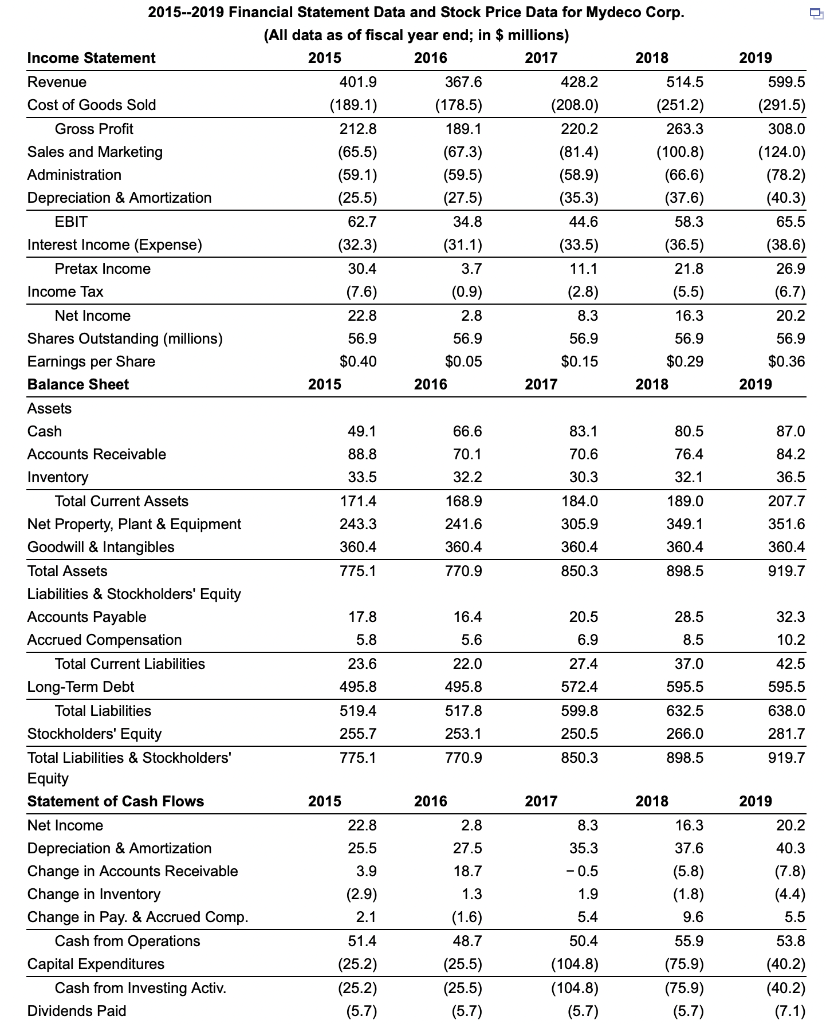
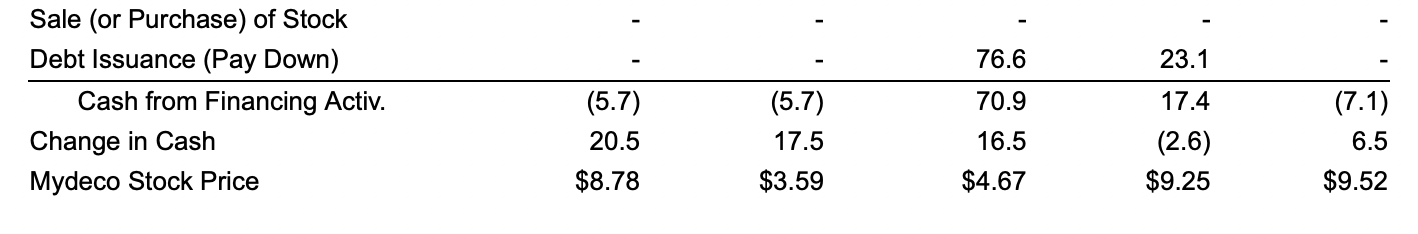
See Table 2.5 ' showing financial statement data and stock price data for Mydeco Corp. a. By what percentage did Mydeco's revenues grow each year from 2018-2019? b. By what percentage did net Income grow each year? c. Why might the growth rates of revenues and net income differ? a. By what percentage did Mydeco's revenues grow each year from 2016-2019? The revenues growth for year 2016 is %. (Round to two decimal places.) The revenues growth for year 2017 is %. (Round to two decimal places.) The revenues growth for year 2018 is % (Round to two decimal places.) The revenues growth for year 2019 is % (Round to two decimal places.) b. By what percentage did net income grow each year? The net income growth for year 2016 is %. (Round to two decimal places.) The net income growth for year 2017 is %. (Round to two decimal places.) The net income growth for year 2018 is %. (Round to two decimal places.) The net income growth for year 2019 is %. (Round to two decimal places.) c. Why might the growth rates of revenues and net income differ? (Select from the drop-down menus.) in 2016 by 8.53%, however, cost of goods sold Net income growth rate differs from revenue growth rate because cost of goods sold and other expenses can move at different rates than revenues. For example, revenues (1) (2) by 5.61%. 2019 599.5 (291.5) 308.0 (124.0) (78.2) (40.3) 65.5 (38.6) 26.9 (6.7) 20.2 56.9 $0.36 2019 2015--2019 Financial Statement Data and Stock Price Data for Mydeco Corp. (All data as of fiscal year end; in $ millions) Income Statement 2015 2016 2017 2018 Revenue 401.9 367.6 428.2 514.5 Cost of Goods Sold (189.1) (178.5) (208.0) (251.2) Gross Profit 212.8 189.1 220.2 263.3 Sales and Marketing (65.5) (67.3) (81.4) (100.8) Administration (59.1) (59.5) (58.9) (66.6) Depreciation & Amortization (25.5) (27.5) (35.3) (37.6) EBIT 62.7 34.8 44.6 58.3 Interest Income (Expense) (32.3) (31.1) (33.5) (36.5) Pretax Income 30.4 3.7 11.1 21.8 Income Tax (7.6) (0.9) (2.8) (5.5) Net Income 22.8 2.8 8.3 16.3 Shares Outstanding (millions) 56.9 56.9 56.9 56.9 Earnings per Share $0.40 $0.05 $0.15 $0.29 Balance Sheet 2015 2016 2017 2018 Assets Cash 49.1 66.6 83.1 80.5 Accounts Receivable 88.8 70.1 70.6 76.4 Inventory 33.5 32.2 30.3 32.1 Total Current Assets 171.4 168.9 184.0 189.0 Net Property, Plant & Equipment 243.3 241.6 305.9 349.1 Goodwill & Intangibles 360.4 360.4 360.4 360.4 Total Assets 775.1 770.9 850.3 898.5 Liabilities & Stockholders' Equity Accounts Payable 17.8 16.4 20.5 28.5 Accrued Compensation 5.8 5.6 6.9 8.5 Total Current Liabilities 23.6 22.0 27.4 37.0 Long-Term Debt 495.8 495.8 572.4 595.5 Total Liabilities 519.4 517.8 599.8 632.5 Stockholders' Equity 255.7 253.1 250.5 266.0 Total Liabilities & Stockholders' 775.1 770.9 850.3 898.5 Equity Statement of Cash Flows 2015 2016 2017 2018 Net Income 22.8 2.8 8.3 16.3 Depreciation & Amortization 25.5 27.5 35.3 37.6 Change in Accounts Receivable 3.9 18.7 -0.5 (5.8) Change in Inventory (2.9) 1.3 1.9 (1.8) Change in Pay. & Accrued Comp. 2.1 (1.6) 5.4 9.6 Cash from Operations 51.4 48.7 50.4 55.9 Capital Expenditures (25.2) (25.5) (104.8) (75.9) Cash from Investing Activ. (25.2) (25.5) (104.8) (75.9) Dividends Paid (5.7) (5.7) (5.7) (5.7) 87.0 84.2 36.5 207.7 351.6 360.4 919.7 32.3 10.2 42.5 595.5 638.0 281.7 919.7 2019 20.2 40.3 (7.8) (4.4) 5.5 53.8 (40.2) (40.2) (7.1) 76.6 23.1 Sale (or Purchase) of Stock Debt Issuance (Pay Down) Cash from Financing Activ. Change in Cash Mydeco Stock Price 70.9 17.4 (5.7) 20.5 $8.78 (5.7) 17.5 $3.59 16.5 $4.67 (2.6) $9.25 (7.1) 6.5 $9.52
Step by Step Solution
There are 3 Steps involved in it

Get step-by-step solutions from verified subject matter experts