

Question: See Table 2.5 showing financial statement data and stock price data for Mydeco Corp. Suppose Mydeco had purchased additional equipment for $12 million at
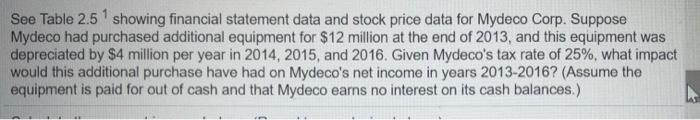
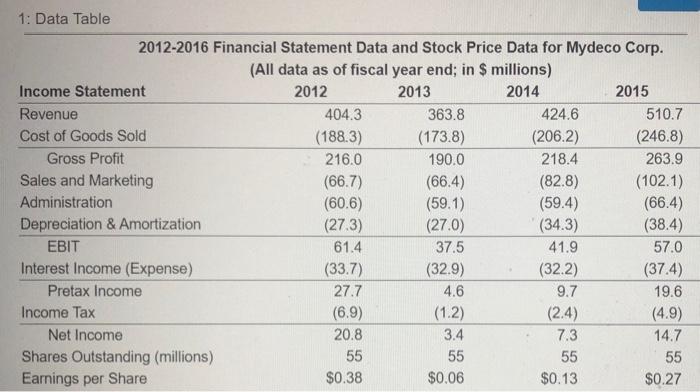
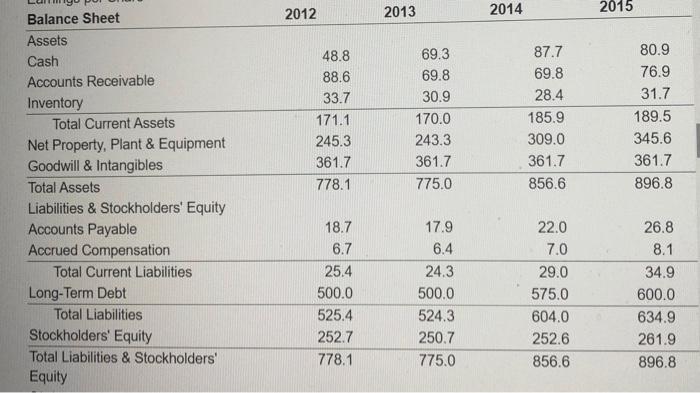
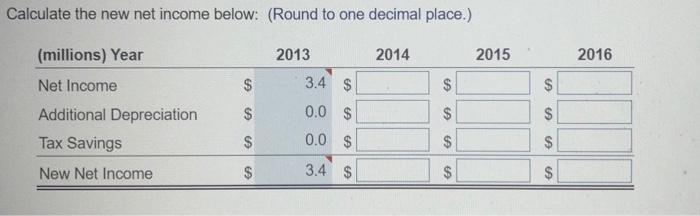
See Table 2.5 " showing financial statement data and stock price data for Mydeco Corp. Suppose Mydeco had purchased additional equipment for $12 million at the end of 2013, and this equipment was depreciated by $4 million per year in 2014, 2015, and 2016. Given Mydeco's tax rate of 25%, what impact would this additional purchase have had on Mydeco's net income in years 2013-2016? (Assume the equipment is paid for out of cash and that Mydeco earns no interest on its cash balances.) 1: Data Table 2012-2016 Financial Statement Data and Stock Price Data for Mydeco Corp. (All data as of fiscal year end; in $ millions) Income Statement 2012 2013 2014 2015 Revenue 404.3 363.8 424.6 510.7 Cost of Goods Sold (188.3) (173.8) (206.2) (246.8) Gross Profit 216.0 190.0 218.4 263.9 Sales and Marketing (66.7) (66.4) (82.8) (102.1) Administration (60.6) (59.1) (59.4) (66.4) Depreciation & Amortization (273) (27.0) (34.3) (38.4) EBIT 61.4 37.5 41.9 57.0 Interest Income (Expense) (33.7) (32.9) (32.2) (37.4) Pretax Income 27.7 4.6 9.7 19.6 Income Tax (6.9) (1.2) (2.4) (4.9) Net Income 20.8 3.4 14.7 Shares Outstanding (millions) 55 55 55 55 Earnings per Share $0.38 $0.06 $0.13 $0.27 7.3 2012 2013 2014 2015 48.8 88.6 33.7 171.1 245.3 361.7 778.1 69.3 69.8 30.9 170.0 243.3 361.7 87.7 69.8 28.4 185.9 309.0 361.7 856.6 80.9 76.9 31.7 189.5 345.6 361.7 896.8 775.0 Balance Sheet Assets Cash Accounts Receivable Inventory Total Current Assets Net Property, Plant & Equipment Goodwill & Intangibles Total Assets Liabilities & Stockholders' Equity Accounts Payable Accrued Compensation Total Current Liabilities Long-Term Debt Total Liabilities Stockholders' Equity Total Liabilities & Stockholders' Equity 18.7 6.7 25.4 500.0 525.4 252.7 778.1 17.9 6.4 24.3 500.0 524.3 250.7 775.0 22.0 7.0 29.0 575.0 604.0 252.6 856.6 26.8 8.1 34.9 600.0 634.9 261.9 896.8 Statement of Cash Flows Net Income Depreciation & Amortization Change in Accounts Receivable Change in Inventory Change in Pay. & Accrued Comp. Cash from Operations Capital Expenditures Cash from Investing Activ. Dividends Paid Sale (or Purchase) of Stock Debt Issuance (Pay Down) Cash from Financing Activ. Change in Cash Mydeco Stock Price 2012 20.8 27.3 3.9 (2.9) 2.2 51.3 (25.0) (25.0) (5.4) 2013 3.4 27.0 18.8 2.8 (1.1) 50.9 (25.0) (25.0) (5.4) 2014 7.3 34.3 0.0 2.5 4.7 48.8 (100.0) (100.0) (5.4) 2015 14.7 38.4 (7.1) (3.3) 5.9 48.6 (75.0) (75.0) (5.4) (5.4) 20.9 $7.92 (5.4) 20.5 $3.30 75.0 69.6 18.4 $5.25 25.0 19.6 (6.8) $8.71 Calculate the new net income below: (Round to one decimal place.) (millions) Year 2013 2014 2015 2016 $ 3.4 $ $ $ $ $ 0.0 $ $ Net Income Additional Depreciation Tax Savings New Net Income $ 0.0 $ $ $ $ $ $ 3.4 $ $
Step by Step Solution
There are 3 Steps involved in it

Get step-by-step solutions from verified subject matter experts