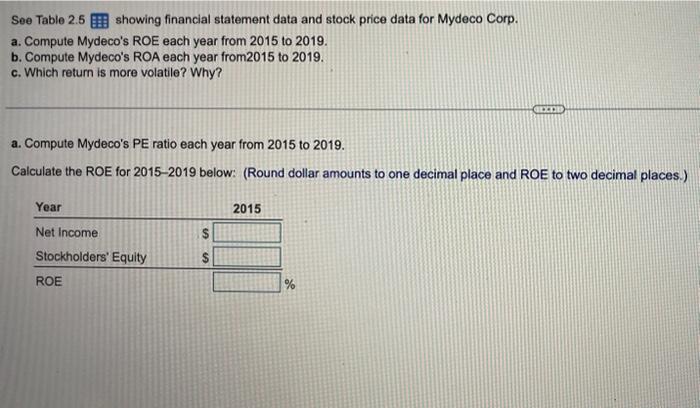
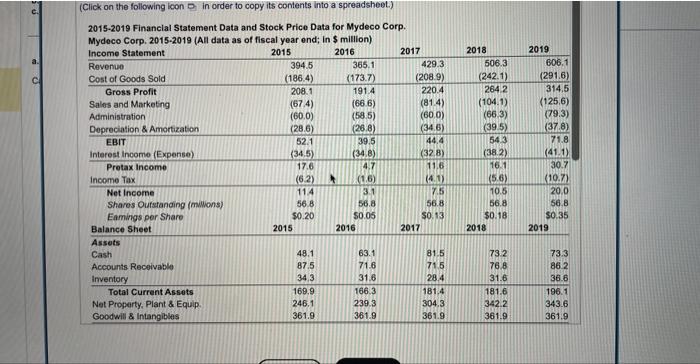
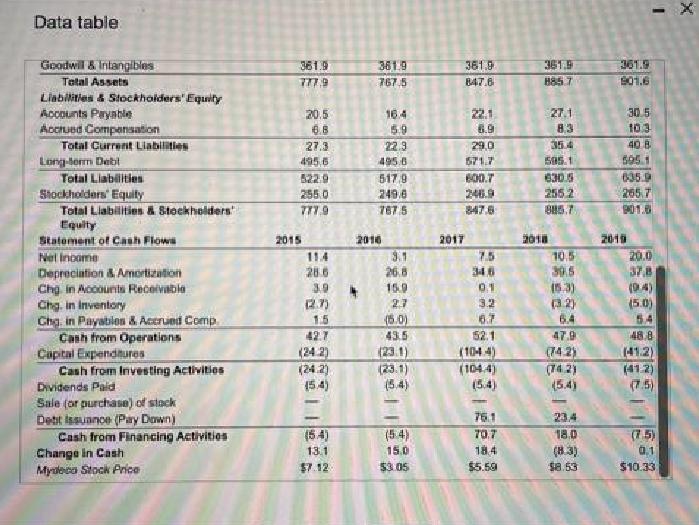
See Table 2.5 showing financial statement data and stock price data for Mydeco Corp. a. Compute...
Fantastic news! We've Found the answer you've been seeking!
Question:
Transcribed Image Text:
See Table 2.5 showing financial statement data and stock price data for Mydeco Corp. a. Compute Mydeco's ROE each year from 2015 to 2019. b. Compute Mydeco's ROA each year from2015 to 2019. c. Which return is more volatile? Why? a. Compute Mydeco's PE ratio each year from 2015 to 2019. Calculate the ROE for 2015-2019 below: (Round dollar amounts to one decimal place and ROE to two decimal places.) Year Net Income Stockholders' Equity ROE $ 46 2015 GLOB % (Click on the following icon in order to copy its contents into a spreadsheet.) 2015-2019 Financial Statement Data and Stock Price Data for Mydeco Corp. Mydeco Corp. 2015-2019 (All data as of fiscal year end; in $ million) Income Statement 2015 2016 Revenue Cost of Goods Sold Gross Profit Sales and Marketing Administration Depreciation & Amortization EBIT Interest Income (Expense) Pretax Income Income Tax Net Income Shares Outstanding (millions) Eamings per Share Balance Sheet Assets Cash Accounts Receivable Inventory Total Current Assets Net Property, Plant & Equip. Goodwill & Intangibles 394.5 (186.4) 208.1 (67.4) (60.0) (28.6) 52.1 (34.5) 17.6 (6.2) * 114 56.8 $0.20 2015 48.1 87.5 34.3 169.9 246.1 361.9 365.1 (173.7) 191.4 (66.6) (58.5) (26.8) 39.5 (34,8) 4.7 (1.6) 3.1 56.8 $0.05 2016 63.1 71.6 31.6 166.3 239.3 361.9 2017 429.3 (208.9) 220.4 (81.4) (60.0) (34.6) 44.4 (32.8) 11.6 (4.1) 7.5 56.8 $0.13 2017 81.5 71.5 28.4 181.4 304.3 361.9 2018 506.3 (242.1) 264.2 (104.1) (66.3) (39.5) 54.3 (38.2) 16.1 (5.6) 10.5 56.8 $0.18 2018 73.2 76.8 31.6 181.6 342.2 361.9 2019 606.1 (291.6) 314.5 (125.6) (79.3) (37.8) 71.8 (41.1) 30.7 (10.7) 20.0 56.8 $0.35 2019 73.3 86.2 36.6 196.1 343.6 361.9 Data table Goodwill & Intangibles Total Assets Liabilities & Stockholders' Equity Accounts Payable Accrued Compensation Total Current Liabilities Long-term Debl Total Liabilities Stockholders' Equity Total Liabilities & Stockholders Equity Statement of Cash Flows Net Income Depreciation & Amortization Chg in Accounts Receivable Chg. in Inventory Chg, in Payables & Accrued Comp Cash from Operations Capital Expenditures Cash from Investing Activities Dividends Paid Sale (or purchase) of stock Debt Issuance (Pay Down) Cash from Financing Activities Change in Cash Mydeco Stock Price 361.9 777.9 20.5 6.8 27.3 495.6 522.9 255.0 777.9 2015 11.4 28.6 3.9 (2.7) 1.5 42.7 (242) (24.2) (5.4) (5.4) 13.1 $7.12 361.9 767.5 25 2016 16.4 5.9 22.3 495.6 517.9 249.6 767.5 3.1 26.8 15.9 2.7 (5.0) 43.5 (23.1) (23.1) (5.4) (5.4) 15.0 53.05 361.9 847.6 22.1 6.9 29,0 571.7 600.7 246.9 847.6 2017 7.5 346 0.1 3.2 6.7 52.1 (1044) (104.4) (5.4) 76.1 70.7 18.4 $5.59 361.9 885.7 27.1 8.3 35.4 595.1 630.5 255.2 885.7 2018 10.5 30.5 (15.3) (32) 47.9 (74.2) (74.2) (5.4) 234 18.0 (8.3) $8.53 361.9 901.6 30.5 10.3 40.8 595.1 635.9 265.7 901.0 2019 20.0 37.8 (9.4) (5.0) 54 48.8 (41.2) (41.2) (7.5) (7.5) 0.1 $10.33 See Table 2.5 showing financial statement data and stock price data for Mydeco Corp. a. Compute Mydeco's ROE each year from 2015 to 2019. b. Compute Mydeco's ROA each year from2015 to 2019. c. Which return is more volatile? Why? a. Compute Mydeco's PE ratio each year from 2015 to 2019. Calculate the ROE for 2015-2019 below: (Round dollar amounts to one decimal place and ROE to two decimal places.) Year Net Income Stockholders' Equity ROE $ 46 2015 GLOB % (Click on the following icon in order to copy its contents into a spreadsheet.) 2015-2019 Financial Statement Data and Stock Price Data for Mydeco Corp. Mydeco Corp. 2015-2019 (All data as of fiscal year end; in $ million) Income Statement 2015 2016 Revenue Cost of Goods Sold Gross Profit Sales and Marketing Administration Depreciation & Amortization EBIT Interest Income (Expense) Pretax Income Income Tax Net Income Shares Outstanding (millions) Eamings per Share Balance Sheet Assets Cash Accounts Receivable Inventory Total Current Assets Net Property, Plant & Equip. Goodwill & Intangibles 394.5 (186.4) 208.1 (67.4) (60.0) (28.6) 52.1 (34.5) 17.6 (6.2) * 114 56.8 $0.20 2015 48.1 87.5 34.3 169.9 246.1 361.9 365.1 (173.7) 191.4 (66.6) (58.5) (26.8) 39.5 (34,8) 4.7 (1.6) 3.1 56.8 $0.05 2016 63.1 71.6 31.6 166.3 239.3 361.9 2017 429.3 (208.9) 220.4 (81.4) (60.0) (34.6) 44.4 (32.8) 11.6 (4.1) 7.5 56.8 $0.13 2017 81.5 71.5 28.4 181.4 304.3 361.9 2018 506.3 (242.1) 264.2 (104.1) (66.3) (39.5) 54.3 (38.2) 16.1 (5.6) 10.5 56.8 $0.18 2018 73.2 76.8 31.6 181.6 342.2 361.9 2019 606.1 (291.6) 314.5 (125.6) (79.3) (37.8) 71.8 (41.1) 30.7 (10.7) 20.0 56.8 $0.35 2019 73.3 86.2 36.6 196.1 343.6 361.9 Data table Goodwill & Intangibles Total Assets Liabilities & Stockholders' Equity Accounts Payable Accrued Compensation Total Current Liabilities Long-term Debl Total Liabilities Stockholders' Equity Total Liabilities & Stockholders Equity Statement of Cash Flows Net Income Depreciation & Amortization Chg in Accounts Receivable Chg. in Inventory Chg, in Payables & Accrued Comp Cash from Operations Capital Expenditures Cash from Investing Activities Dividends Paid Sale (or purchase) of stock Debt Issuance (Pay Down) Cash from Financing Activities Change in Cash Mydeco Stock Price 361.9 777.9 20.5 6.8 27.3 495.6 522.9 255.0 777.9 2015 11.4 28.6 3.9 (2.7) 1.5 42.7 (242) (24.2) (5.4) (5.4) 13.1 $7.12 361.9 767.5 25 2016 16.4 5.9 22.3 495.6 517.9 249.6 767.5 3.1 26.8 15.9 2.7 (5.0) 43.5 (23.1) (23.1) (5.4) (5.4) 15.0 53.05 361.9 847.6 22.1 6.9 29,0 571.7 600.7 246.9 847.6 2017 7.5 346 0.1 3.2 6.7 52.1 (1044) (104.4) (5.4) 76.1 70.7 18.4 $5.59 361.9 885.7 27.1 8.3 35.4 595.1 630.5 255.2 885.7 2018 10.5 30.5 (15.3) (32) 47.9 (74.2) (74.2) (5.4) 234 18.0 (8.3) $8.53 361.9 901.6 30.5 10.3 40.8 595.1 635.9 265.7 901.0 2019 20.0 37.8 (9.4) (5.0) 54 48.8 (41.2) (41.2) (7.5) (7.5) 0.1 $10.33
Expert Answer:
Answer rating: 100% (QA)
ANSWER Okay lets calculate the ROE for Mydeco Corp from 2015 to 2019 ROE Net Income Stockholders Equity 2015 ROE Net Income 2015 114 million Stockhold... View the full answer
Related Book For
Posted Date:
Students also viewed these finance questions
-
See Table 2.5 showing financial statement data and stock price data for Mydeco Corp. a. Compute Mydecos ROE each year from 2009 to 2013. b. Compute Mydecos ROA each year from 2009 to 2013. c. Which...
-
See Table 2.5 showing financial statement data and stock price data for Mydeco Corp. a. Compute Mydecos PE ratio each year from 2009 to 2013. In which year was it the highest? b. What was Mydecos...
-
See Table 2.5 showing financial statement data and stock price data for Mydeco Corp. Suppose Mydeco repurchases 2 million shares each year from 2010 to 2013. What would its earnings per share be in...
-
1) Determine the pH of a 4.3*10^-4 M NaOH solution. 2) why would we say that a solution with a H+ concentration of 1.00*10^-7 M is said to be neutral if it contains acid, shouldn't be acidic?
-
Accounts and Notes Payable the following are selected 2010 transactions of Darby Corporation. Sept. 1 Purchased inventory from Orion Company on account for $50,000. Darby records purchases gross and...
-
Find the response of a damped single-degree-of-freedom system with the equation of motion \[m \ddot{x}+c \dot{x}+k x=F(t)\] using Runge-Kutta method. Assume that \(m=5 \mathrm{~kg}, c=200...
-
The breaking strength of hockey stick shafts made of two different graphite-kevlar composites yields the following results (in newtons). Can you conclude that the standard deviation of the breaking...
-
Kate's Kite Company (a corporation) sells and repairs kites from manufacturers around the world. Its stores are located in rented space in malls and shopping centers. During its first month of...
-
4. Examine Southwest Airlines by providing a detailed analysis of their financials ( (at a minimum, cover one ratio each from profitability, liquidity, leverage, and activity ratios). Compare...
-
Beth R. Jordan lives at 2322 Skyview Road, Mesa, AZ 85201. She is a tax accountant with Mesa Manufacturing Company, 1203 Western Avenue, Mesa, AZ 85201 (employer identification number 11-1111111)....
-
Determine IE, VC and VCE for the network of Fig. 1. X is equal to12 O - XV 2.2 k2 VCE + Vc IE 1.8 k2 10 V
-
1. A train moving 1.5 hrs travels 255 km travels east and then 488 km [20 W of N] . Algebraically find the train average velocity for the trip? 2. A captain of small boat has determined that in 4 hrs...
-
Given the function r(x) = x 2x 6, find its domain and range. Domain: Range:
-
How to be a data analyst step by step for beginners? what skills needs to be learned or focus in order to be a data analyst? tell us any small project as an example of data analyst?
-
Ketting Co., a public company, reported the following reconciliation of retained earnings on its draft statement of changes in shareholders' equity for the year ended December 31, 2021: 2021 2020...
-
Calculate the below: a) Using 3 month moving average, forecast for periods 6-11 b) Using 5 month moving average, forecast for periods 6-11 c) Calculate mean absolute deviation for each period for...
-
Using C language and PIC16F917 microcontroller, implement PID control for fan motor speed control and project design
-
Without solving, determine the character of the solutions of each equation in the complex number system. 3x 2 3x + 4 = 0
-
During the Internet boom of the late 1990s, the stock prices of many Internet firms soared to extreme heights. As CEO of such a firm, if you believed your stock was significantly overvalued, would...
-
Beru.com recently raised $5 million with a pre-money value of $9 million. They are seeking to raise another $6 million. What is the largest fraction of the firm they can offer and avoid a down round?
-
What is the essential trade-off faced by government in designing regulation of public firms?
-
When there is a concentration gradient in the system, show that the potential gradient is composed of two terms, (i) an Ohm's-law contribution and (ii) a diffusional contribution. State the equation...
-
Copper is deposited at a cathode from solution with a bulk concentration of \(0.5 \mathrm{M}\) at the rate of \(3.0 \mathrm{~g} / \mathrm{m}^{2} \cdot \mathrm{s}\). Find the surface concentration of...
-
Find the mobility of \(\mathrm{H}^{+}, \mathrm{OH}^{-}\), and other ions from the diffusivity data given in Table 22.1. Table 22.1. Diffusion coefficients of ions in water at 25 C. H+ Na+ K+ Ca+ OH-...
Study smarter with the SolutionInn App