

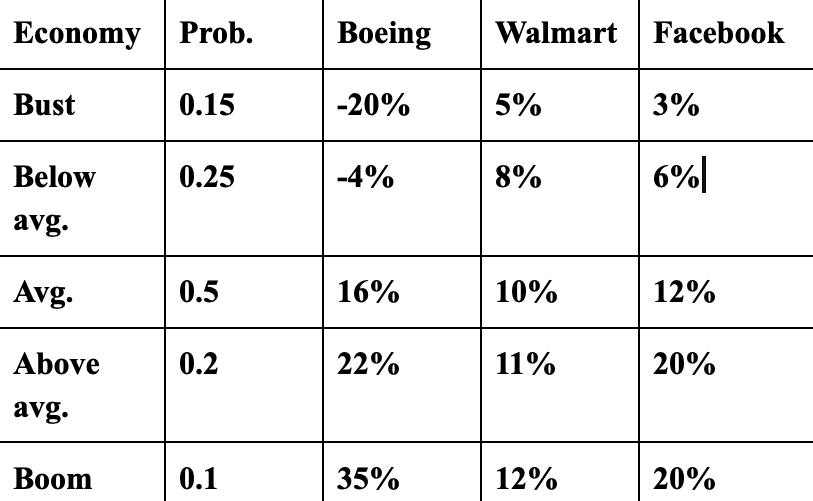
Question: See the attached table for the probability distributions stock returns of companies at different economic conditions. 1) Calculate the expected return, variance, and standard deviation
See the attached table for the probability distributions stock returns of companies at different economic conditions.
1) Calculate the expected return, variance, and standard deviation of each company. Show your calculations step by step and formulas used.
2) If you are looking for the stock with the least risk, then which stock should you pick and why?
3) The Federal Reserve is fighting inflation through the attempts of increasing interest rate. Explain what would happen to equity prices if people have these two results in the next 2 years with increasing interest rates
- Decreases in the supply of goods and services.
- Increase in the supply of goods and services.
Step by Step Solution
There are 3 Steps involved in it

Get step-by-step solutions from verified subject matter experts