

Question: See the excel sheet provided . Analyze the risk-return trade-off that would have characterized portfolios constructed from Stocks and Treasury bonds over the last 20
- See the excel sheet provided
 . Analyze the risk-return trade-off that would have characterized portfolios constructed from Stocks and Treasury bonds over the last 20 years. Use Excel to answer the following:
 - What were the average rate of return and standard deviation of each asset?
(hint: use AVERAGE and STDEV.S functions)
- What was the correlation coefficient of their annual returns?
(hint: use CORREL function)
- What would have been the average return and standard deviation of the portfolios with differing weights in the two assets?
(hint: consider weights in stocks starting at 0 and increment by 0.1 up to 1.0).
- What were the average return and standard deviation of the minimum-variance combination of stocks and bonds?
- Graph the investment opportunity set based on your answers in part c above.
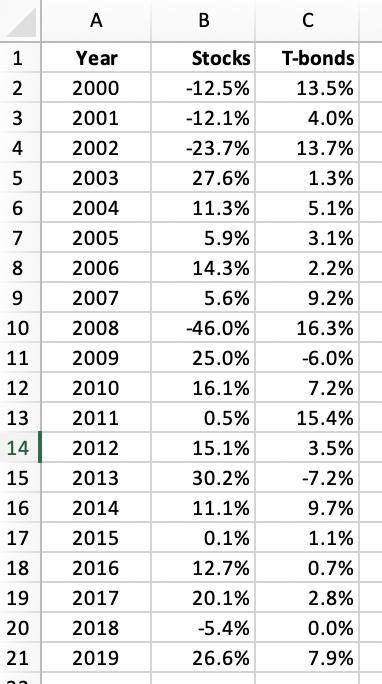
. B C 1 2 N 3 4 5 6 7 8 9 10 11 12 13 14 15 16 17 18 19 20 21 Year 2000 2001 2002 2003 2004 2005 2006 2007 2008 2009 2010 2011 2012 2013 2014 2015 2016 2017 2018 2019 Stocks -12.5% -12.1% -23.7% 27.6% 11.3% 5.9% 14.3% 5.6% -46.0% 25.0% 16.1% 0.5% 15.1% 30.2% 11.1% 0.1% 12.7% 20.1% -5.4% 26.6% T-bonds 13.5% 4.0% 13.7% 1.3% 5.1% 3.1% 2.2% 9.2% 16.3% -6.0% 7.2% 15.4% 3.5% -7.2% 9.7% 1.1% 0.7% 2.8% 0.0% 7.9%
Step by Step Solution
There are 3 Steps involved in it
1 Expert Approved Answer
Step: 1 Unlock

Question Has Been Solved by an Expert!
Get step-by-step solutions from verified subject matter experts
Step: 2 Unlock
Step: 3 Unlock