

Question: SEE THE TABLE TO SOLVE: Question 1 10 pts Consider that on January 2, 2014 (Wednesday) you decide to invest in a portfolio consisting of
SEE THE TABLE TO SOLVE:
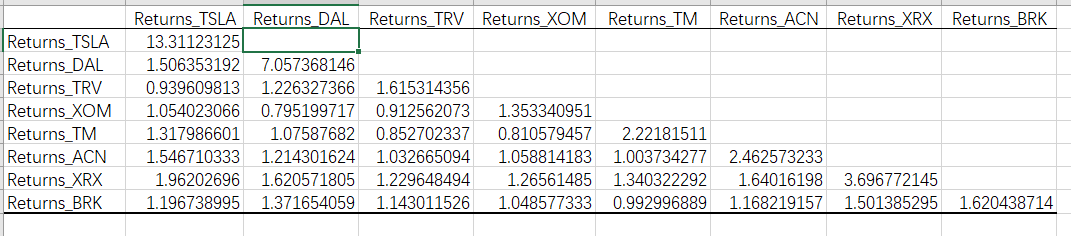
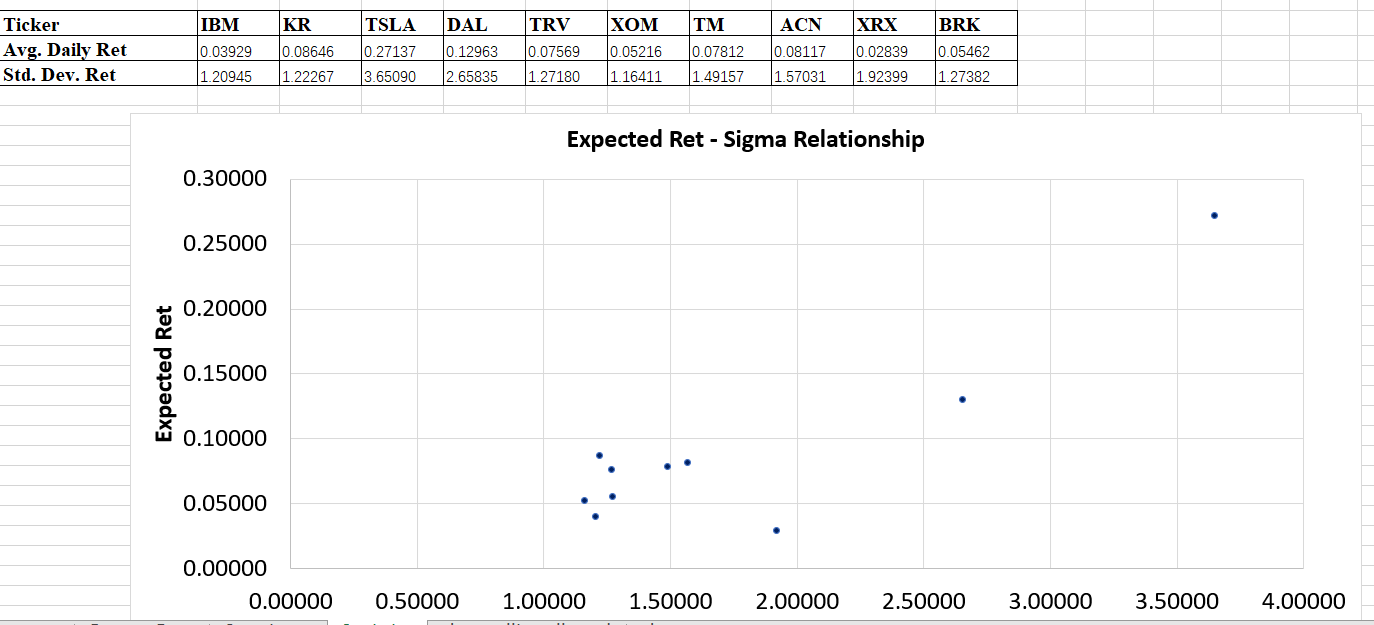
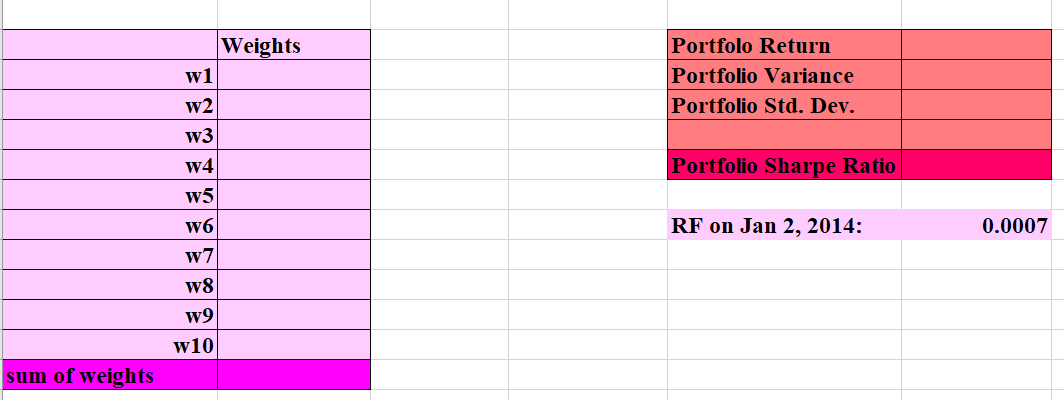
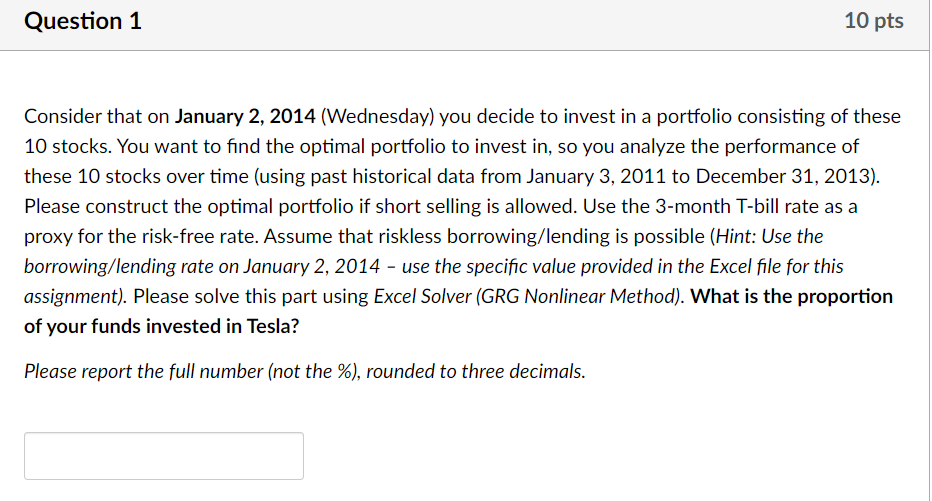
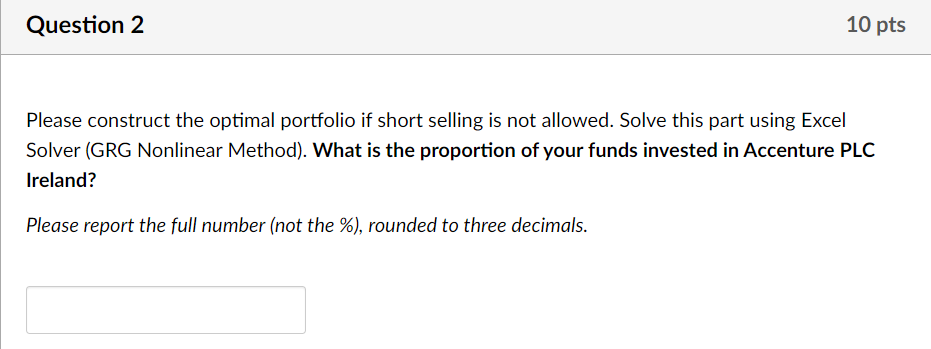
Question 1 10 pts Consider that on January 2, 2014 (Wednesday) you decide to invest in a portfolio consisting of these 10 stocks. You want to find the optimal portfolio to invest in, so you analyze the performance of these 10 stocks over time (using past historical data from January 3, 2011 to December 31, 2013). Please construct the optimal portfolio if short selling is allowed. Use the 3-month T-bill rate as a proxy for the risk-free rate. Assume that riskless borrowing/lending is possible (Hint: Use the borrowing/lending rate on January 2, 2014 - use the specific value provided in the Excel file for this assignment). Please solve this part using Excel Solver (GRG Nonlinear Method). What is the proportion of your funds invested in Tesla? Please report the full number (not the %), rounded to three decimals. Question 2 10 pts Please construct the optimal portfolio if short selling is not allowed. Solve this part using Excel Solver (GRG Nonlinear Method). What is the proportion of your funds invested in Accenture PLC Ireland? Please report the full number (not the %), rounded to three decimals. Returns_TRV Returns_XOM Returns TM Returns_ACN Returns_XRX Returns_BRK Returns_TSLA Returns_DAL Returns_TRV Returns_XOM Returns_TM Returns_ACN Returns XRX Returns BRK Returns_TSLA Returns DAL 13.31123125 1.506353192 7.057368146 0.939609813 1.226327366 1.054023066 0.795199717 1.317986601 1.07587682 1.546710333 1.214301624 1.96202696 1.620571805 1.196738995 1.371654059 1.615314356 0.912562073 0.852702337 1.032665094 1.229648494 1.143011526 1.353340951 0.810579457 1.058814183 1.26561485 1.048577333 2.22181511 1.003734277 1.340322292 0.992996889 2.462573233 1.64016198 1.168219157 3.696772145 1.501385295 1.620438714 TSLA DAL TRV XOM TM XRX Ticker Avg. Daily Ret Std. Dev. Ret IBM 0.03929 1.20945 KR 0.08646 1.22267 ACN 0.08117 0.27137 0.07569 0.12963 2.65835 0.05216 1.16411 0.07812 1.49157 0.02839 1.92399 BRK 0.05462 1.27382 3.65090 1.27180 1.57031 Expected Ret - Sigma Relationship 0.30000 0.25000 0.20000 Expected Ret 0.15000 0.10000 0.05000 0.00000 0.00000 0.50000 1.00000 1.50000 2.00000 2.50000 3.00000 3.50000 4.00000 Weights w1 Portfolo Return Portfolio Variance Portfolio Std. Dev. w2 W3 W4 Portfolio Sharpe Ratio W5 W6 RF on Jan 2, 2014: 0.0007 w7 W8 w9 w10 sum of weights Question 1 10 pts Consider that on January 2, 2014 (Wednesday) you decide to invest in a portfolio consisting of these 10 stocks. You want to find the optimal portfolio to invest in, so you analyze the performance of these 10 stocks over time (using past historical data from January 3, 2011 to December 31, 2013). Please construct the optimal portfolio if short selling is allowed. Use the 3-month T-bill rate as a proxy for the risk-free rate. Assume that riskless borrowing/lending is possible (Hint: Use the borrowing/lending rate on January 2, 2014 - use the specific value provided in the Excel file for this assignment). Please solve this part using Excel Solver (GRG Nonlinear Method). What is the proportion of your funds invested in Tesla? Please report the full number (not the %), rounded to three decimals. Question 2 10 pts Please construct the optimal portfolio if short selling is not allowed. Solve this part using Excel Solver (GRG Nonlinear Method). What is the proportion of your funds invested in Accenture PLC Ireland? Please report the full number (not the %), rounded to three decimals. Returns_TRV Returns_XOM Returns TM Returns_ACN Returns_XRX Returns_BRK Returns_TSLA Returns_DAL Returns_TRV Returns_XOM Returns_TM Returns_ACN Returns XRX Returns BRK Returns_TSLA Returns DAL 13.31123125 1.506353192 7.057368146 0.939609813 1.226327366 1.054023066 0.795199717 1.317986601 1.07587682 1.546710333 1.214301624 1.96202696 1.620571805 1.196738995 1.371654059 1.615314356 0.912562073 0.852702337 1.032665094 1.229648494 1.143011526 1.353340951 0.810579457 1.058814183 1.26561485 1.048577333 2.22181511 1.003734277 1.340322292 0.992996889 2.462573233 1.64016198 1.168219157 3.696772145 1.501385295 1.620438714 TSLA DAL TRV XOM TM XRX Ticker Avg. Daily Ret Std. Dev. Ret IBM 0.03929 1.20945 KR 0.08646 1.22267 ACN 0.08117 0.27137 0.07569 0.12963 2.65835 0.05216 1.16411 0.07812 1.49157 0.02839 1.92399 BRK 0.05462 1.27382 3.65090 1.27180 1.57031 Expected Ret - Sigma Relationship 0.30000 0.25000 0.20000 Expected Ret 0.15000 0.10000 0.05000 0.00000 0.00000 0.50000 1.00000 1.50000 2.00000 2.50000 3.00000 3.50000 4.00000 Weights w1 Portfolo Return Portfolio Variance Portfolio Std. Dev. w2 W3 W4 Portfolio Sharpe Ratio W5 W6 RF on Jan 2, 2014: 0.0007 w7 W8 w9 w10 sum of weights
Step by Step Solution
There are 3 Steps involved in it

Get step-by-step solutions from verified subject matter experts