

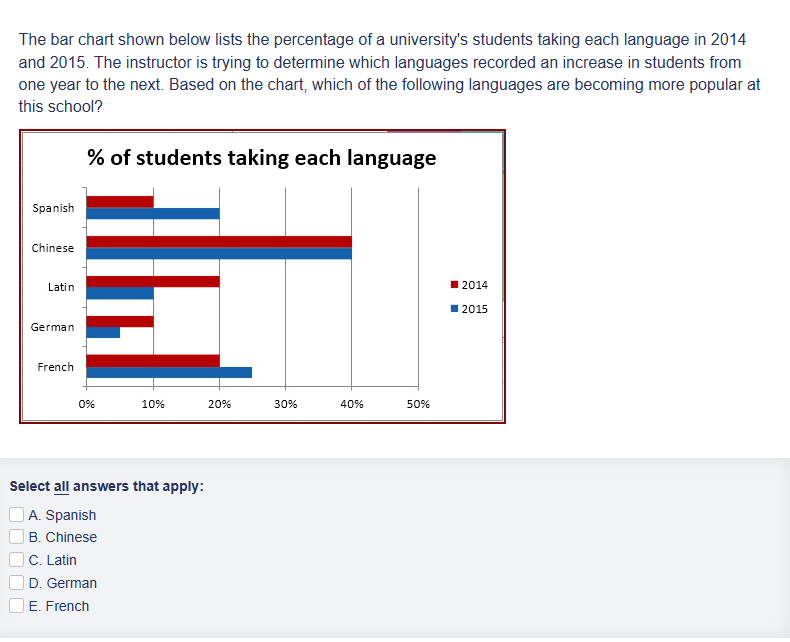
Question: Select all that apply The bar chart shown below lists the percentage of a university's students taking each language in 2014 and 2015. The instructor
Select all that apply
Step by Step Solution
There are 3 Steps involved in it
1 Expert Approved Answer
Step: 1 Unlock

Question Has Been Solved by an Expert!
Get step-by-step solutions from verified subject matter experts
Step: 2 Unlock
Step: 3 Unlock