

Question: Select and arrange (by dragging and dropping) all the steps required to produce the chart shown in Microsoft Excel . The source data for the
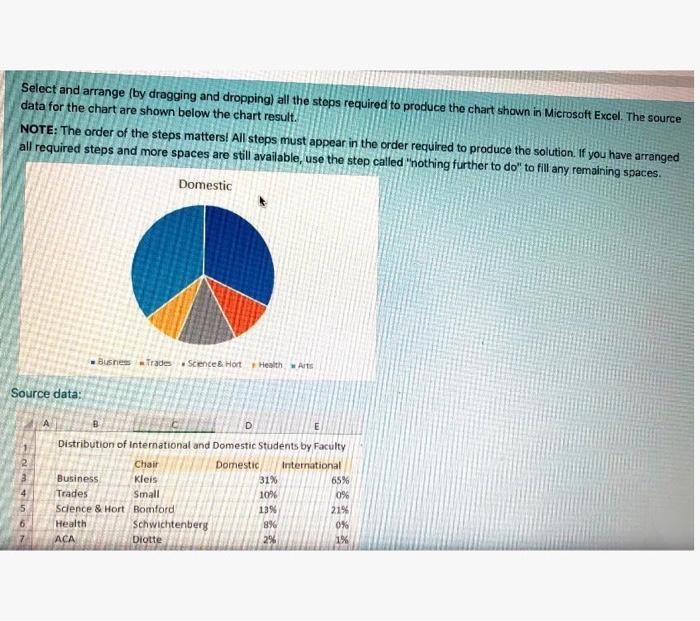
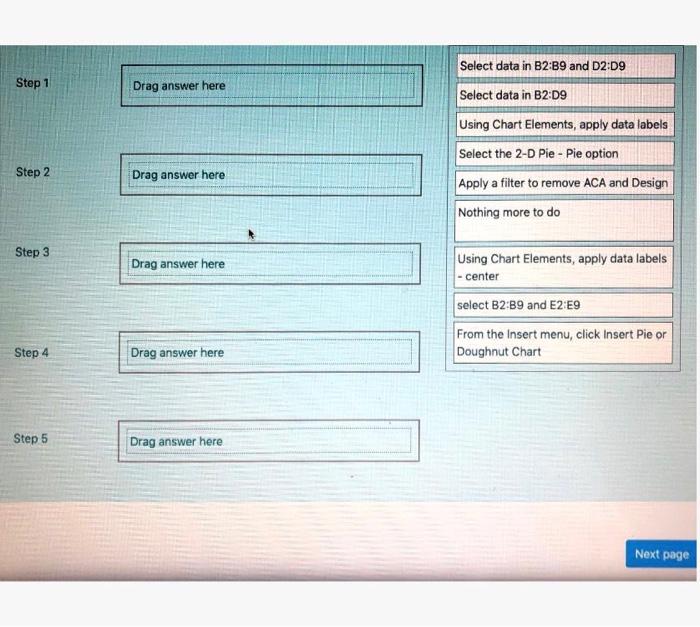
Select and arrange (by dragging and dropping) all the steps required to produce the chart shown in Microsoft Excel . The source data for the chart are shown below the chart result. NOTE: The order of the steps matters! All steps must appear in the order required to produce the solution. If you have arranged all required steps and more spaces are still available, use the step called "nothing further to do" to fill any remaining spaces. Domestic Busnes aides Science & Hot Health Arts Source data: 31% Distribution of International and Domestic Students by Faculty Chair Domestic International Business Kleis 65% Trades Small 1016 0% Science & Hort Bomford 13% 21% Health Schwichtenberg 8% 0% ACA Diotte 2% 1% Select data in B2:B9 and D2:09 Step 1 Drag answer here Select data in B2:09 Using Chart Elements, apply data labels Select the 2-D Pie - Pie option Step 2 Drag answer here Apply a filter to remove ACA and Design Nothing more to do Step 3 Drag answer here Using Chart Elements, apply data labels - center select B2B9 and E2 E9 From the Insert menu, click Insert Pie or Doughnut Chart Step 4 Drag answer here Step 5 Drag answer here Next page Select and arrange (by dragging and dropping) all the steps required to produce the chart shown in Microsoft Excel . The source data for the chart are shown below the chart result. NOTE: The order of the steps matters! All steps must appear in the order required to produce the solution. If you have arranged all required steps and more spaces are still available, use the step called "nothing further to do" to fill any remaining spaces. Domestic Busnes aides Science & Hot Health Arts Source data: 31% Distribution of International and Domestic Students by Faculty Chair Domestic International Business Kleis 65% Trades Small 1016 0% Science & Hort Bomford 13% 21% Health Schwichtenberg 8% 0% ACA Diotte 2% 1% Select data in B2:B9 and D2:09 Step 1 Drag answer here Select data in B2:09 Using Chart Elements, apply data labels Select the 2-D Pie - Pie option Step 2 Drag answer here Apply a filter to remove ACA and Design Nothing more to do Step 3 Drag answer here Using Chart Elements, apply data labels - center select B2B9 and E2 E9 From the Insert menu, click Insert Pie or Doughnut Chart Step 4 Drag answer here Step 5 Drag answer here Next page
Step by Step Solution
There are 3 Steps involved in it

Get step-by-step solutions from verified subject matter experts