

Question: Select one: A B C D The graphs below depict possible demand and supply curve shifts in the market for flowers in Portland. Suppose the
Select one: A B C D
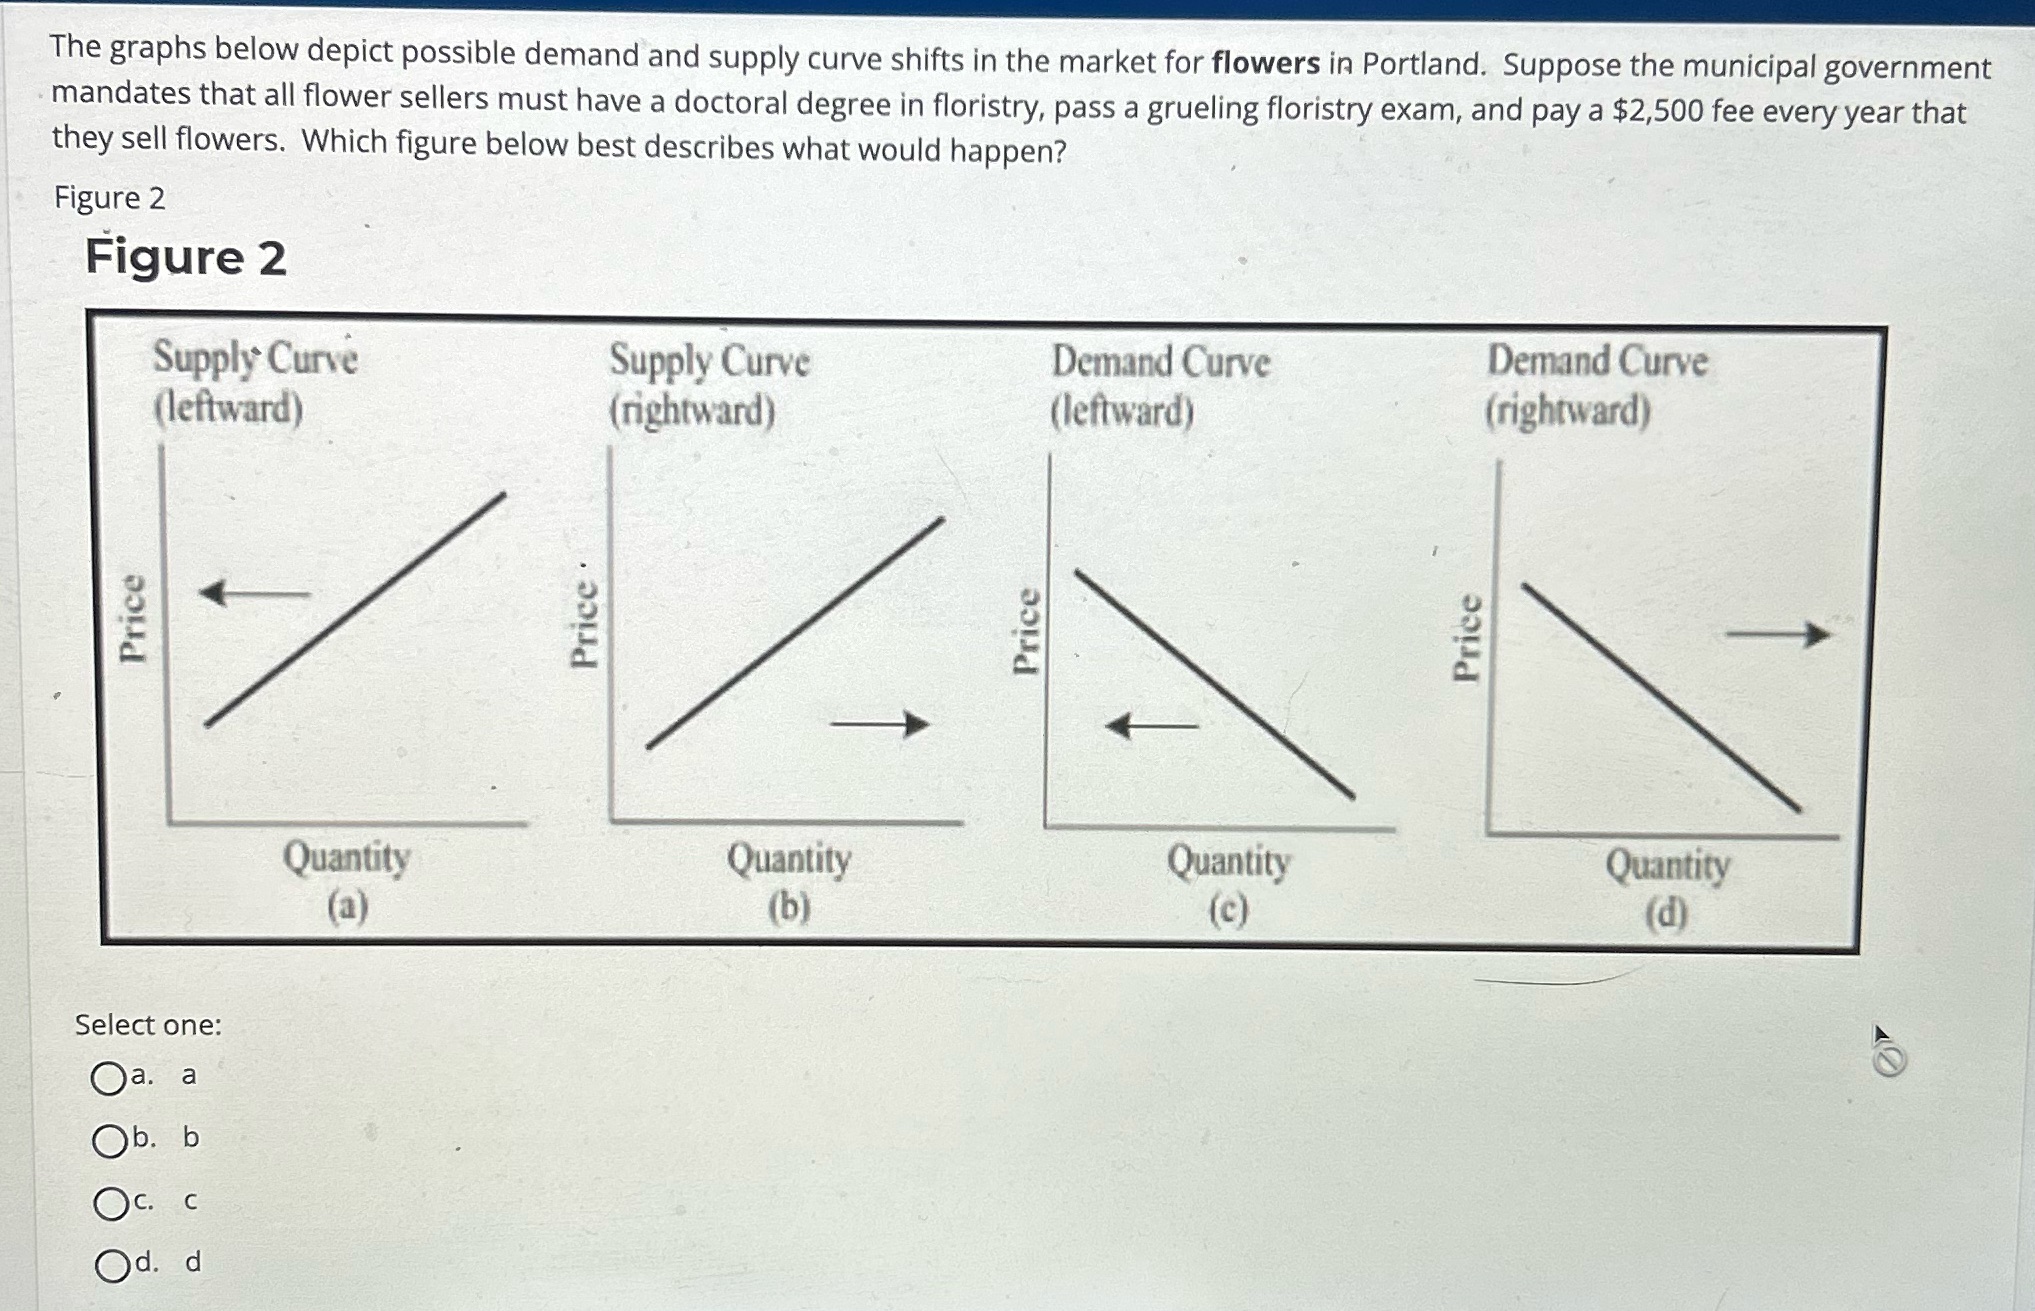
The graphs below depict possible demand and supply curve shifts in the market for flowers in Portland. Suppose the municipal government mandates that all flower sellers must have a doctoral degree in floristry, pass a grueling floristry exam, and pay a $2,500 fee every year that they sell flowers. Which figure below best describes what would happen? Figure 2 Figure 2 Supply Curve Supply Curve Demand Curve Demand Curve (leftward) (rightward) (leftward) (rightward) Price . Price Price Price Quantity Quantity Quantity Quantity (a) (b) (c) (d) Select one: Oa. a Ob. b Oc. C Od. d
Step by Step Solution
There are 3 Steps involved in it
1 Expert Approved Answer
Step: 1 Unlock

Question Has Been Solved by an Expert!
Get step-by-step solutions from verified subject matter experts
Step: 2 Unlock
Step: 3 Unlock