

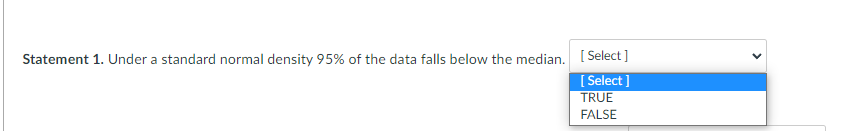
Question: [ Select ] [ Select ] TRUE FALSE Statement 1. Under a standard normal density.r 95% of the data falls below the median. Statement 2.
![[ Select ] [ Select ] TRUE FALSE Statement 1. Under](https://s3.amazonaws.com/si.experts.images/answers/2024/06/6676a23d784d9_8136676a23d620e5.jpg)


![accept the null hypothesis. [ Select ] [ Select ] FALSE TRUEStatement](https://s3.amazonaws.com/si.experts.images/answers/2024/06/6676a23ea4d2f_8146676a23e8c1e2.jpg)
![[ Select ] [ Select ] FALSE TRUEStatement 4: When you have](https://s3.amazonaws.com/si.experts.images/answers/2024/06/6676a23f5dab4_8156676a23f4a491.jpg)
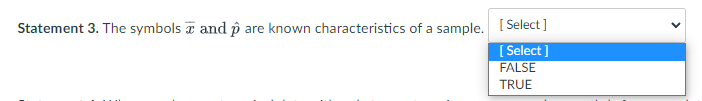
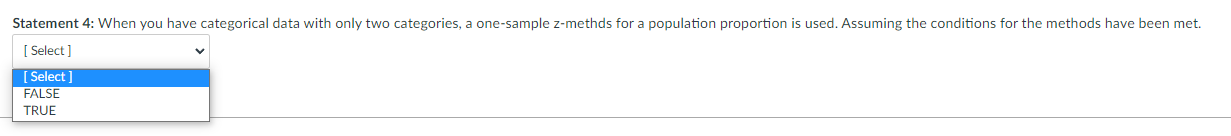
[ Select ] [ Select ] TRUE FALSE Statement 1. Under a standard normal density.r 95% of the data falls below the median. Statement 2. The smaller the p-value, the stronger the evidence is to accept the null hypothesis. [ Select ] [ Select ] FALSE TRUEStatement 3. The symbols + and p are known characteristics of a sample. [ Select ] [ Select ] FALSE TRUEStatement 4: When you have categorical data with only two categories, a one-sample z-methds for a population proportion is used. Assuming the conditions for the methods have been met. [ Select ] [ Select ] FALSE TRUE
Step by Step Solution
There are 3 Steps involved in it
1 Expert Approved Answer
Step: 1 Unlock

Question Has Been Solved by an Expert!
Get step-by-step solutions from verified subject matter experts
Step: 2 Unlock
Step: 3 Unlock