

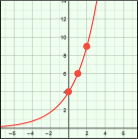
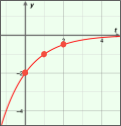
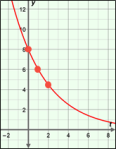
Question: Select Show additional function. Graph y = 5(1 + 0.20) t along with y = 5(1 - 0.20) t . What do the two graphs
- Select Show additional function. Graph y = 5(1 + 0.20)t along with y = 5(1 - 0.20)t.
What do the two graphs have in common?
How are the graphs different?
2. A computer is purchased for $1000 and depreciates (loses value) by 15% each year.
What percent of value does the computer retain each year?
Write function that models the value of the computer after t years. Explain.
3. Use the function y = 98(0.93)t to answer the following questions.
What is the y-intercept of the function?
What is the value of r? Explain.
4. In 2000, the population of Dullville was about 95,000. Over the next decade, the population decreased by 18%. For the questions below, assume this rate of decay will continue.
What function models the population after t decades?
Graph your function in the Gizmo. (Hint: Let y = population in thousands. To enter the initial value, type 95 in the field next to the C slider and hit Enter.) Then select Show probe and drag it to the right. About what will the population be after 30 years (t = 3 decades)?
Roughly when will the population be half the initial population?
5. Use the graph to the right to answer the following questions.
\f\f\f
Step by Step Solution
There are 3 Steps involved in it

Get step-by-step solutions from verified subject matter experts