Question: Select the correct choice which shows your ability to make assumptions in your analysis Based on the analysis, the linear trend model is considered as
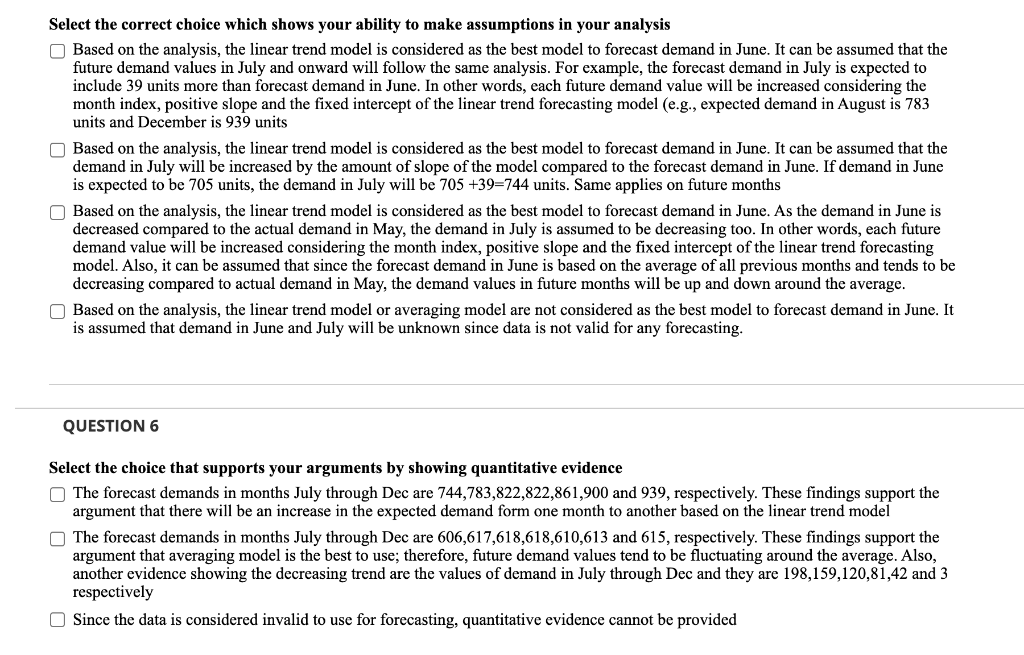
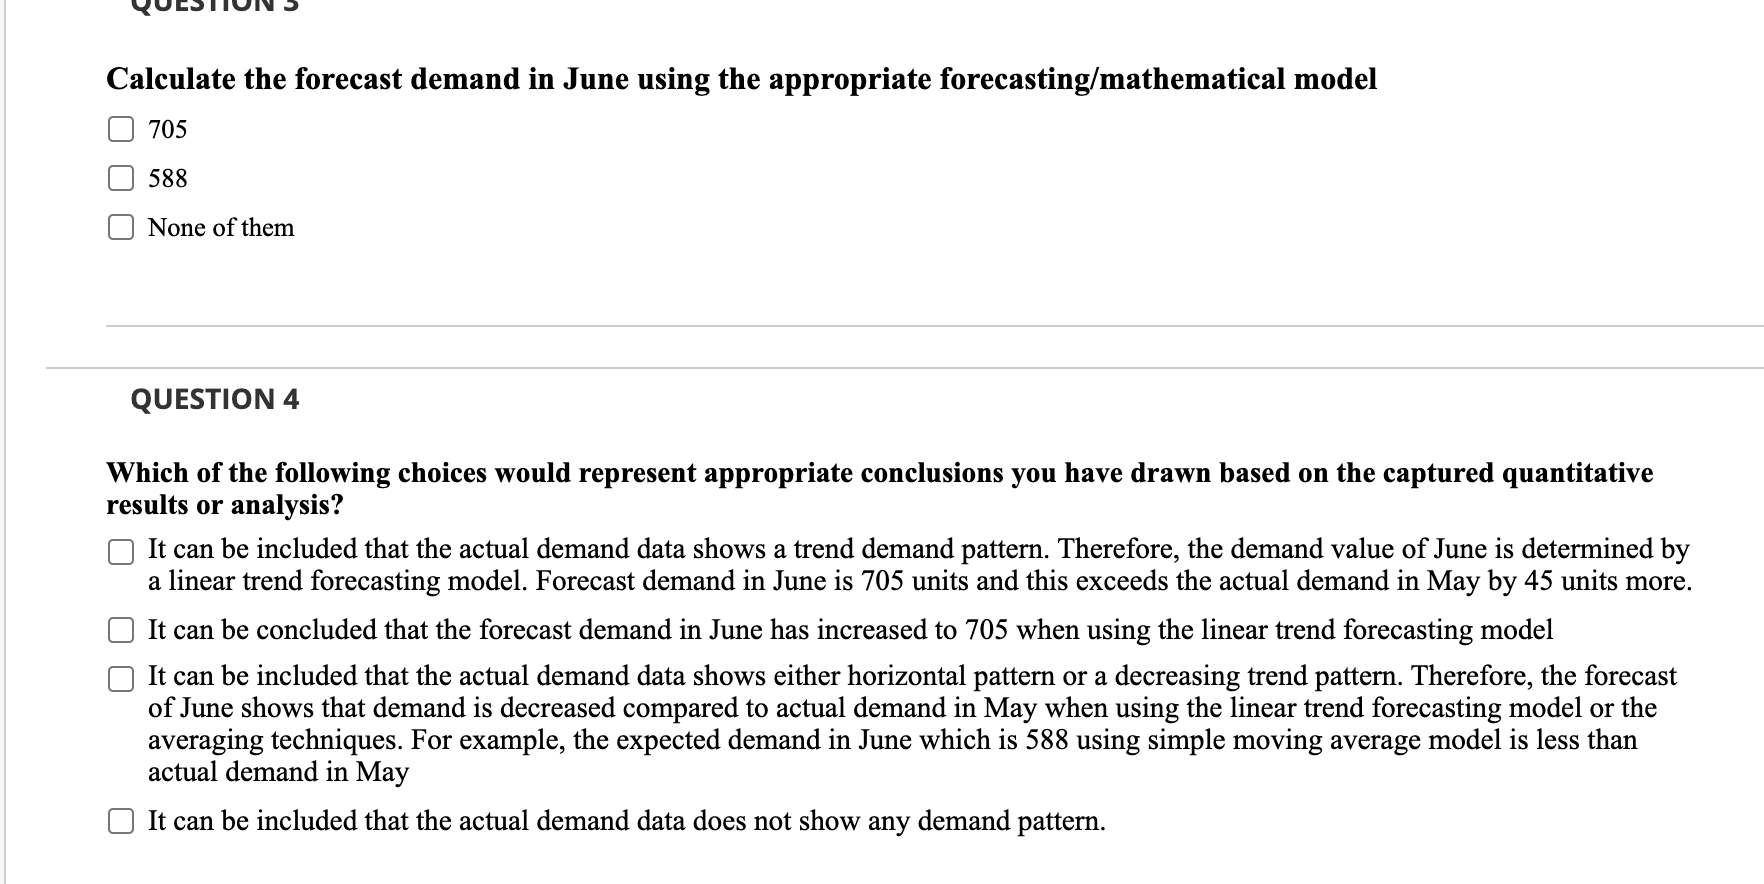
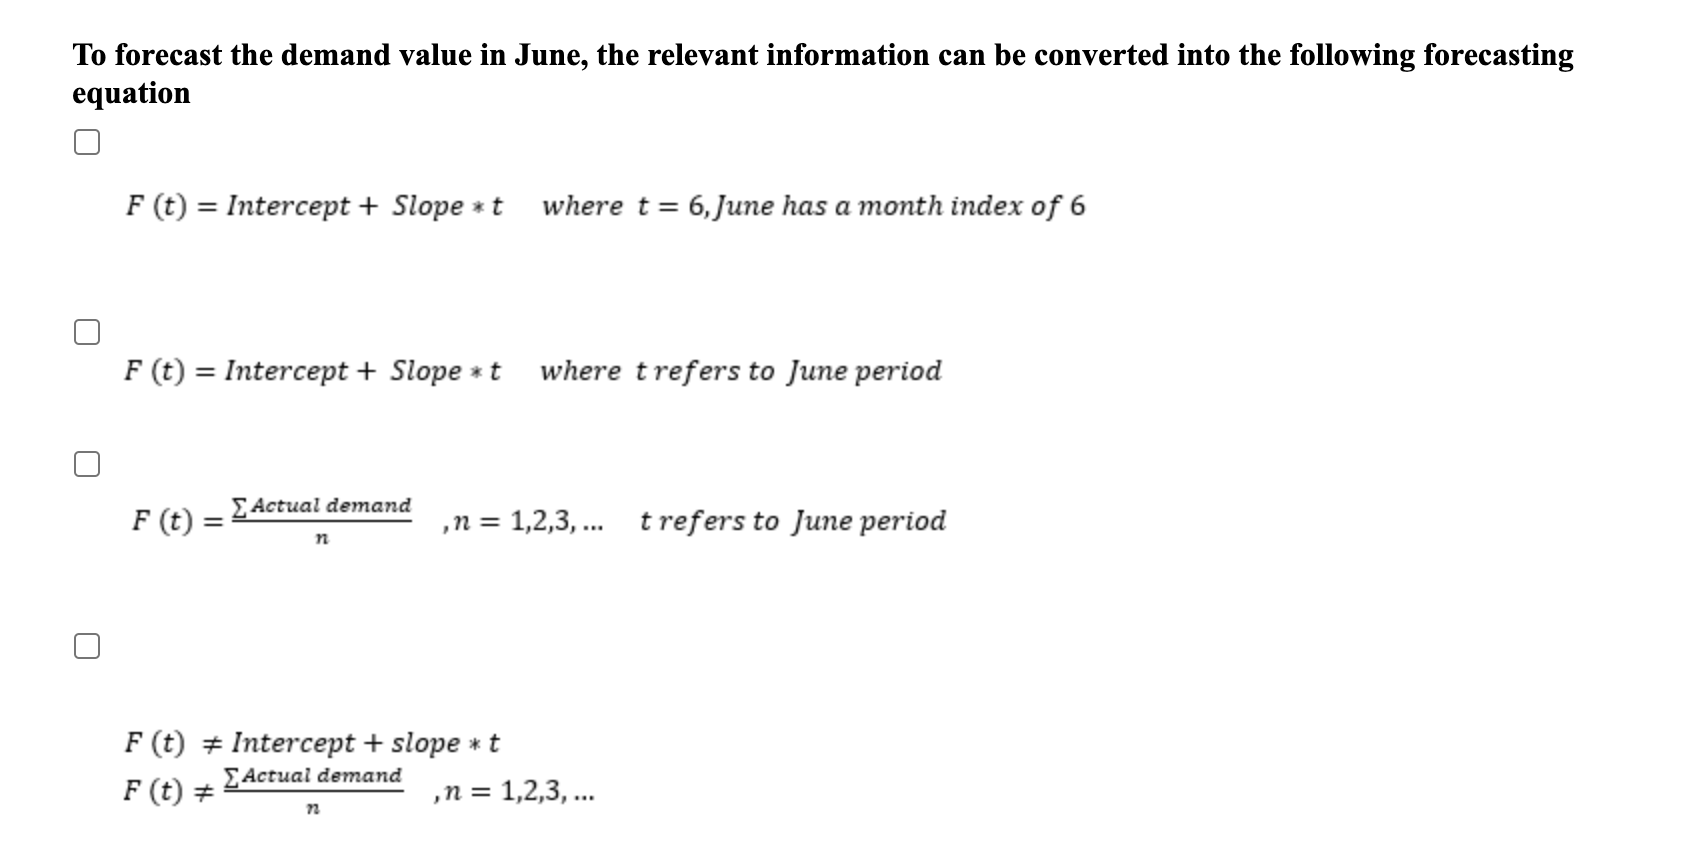
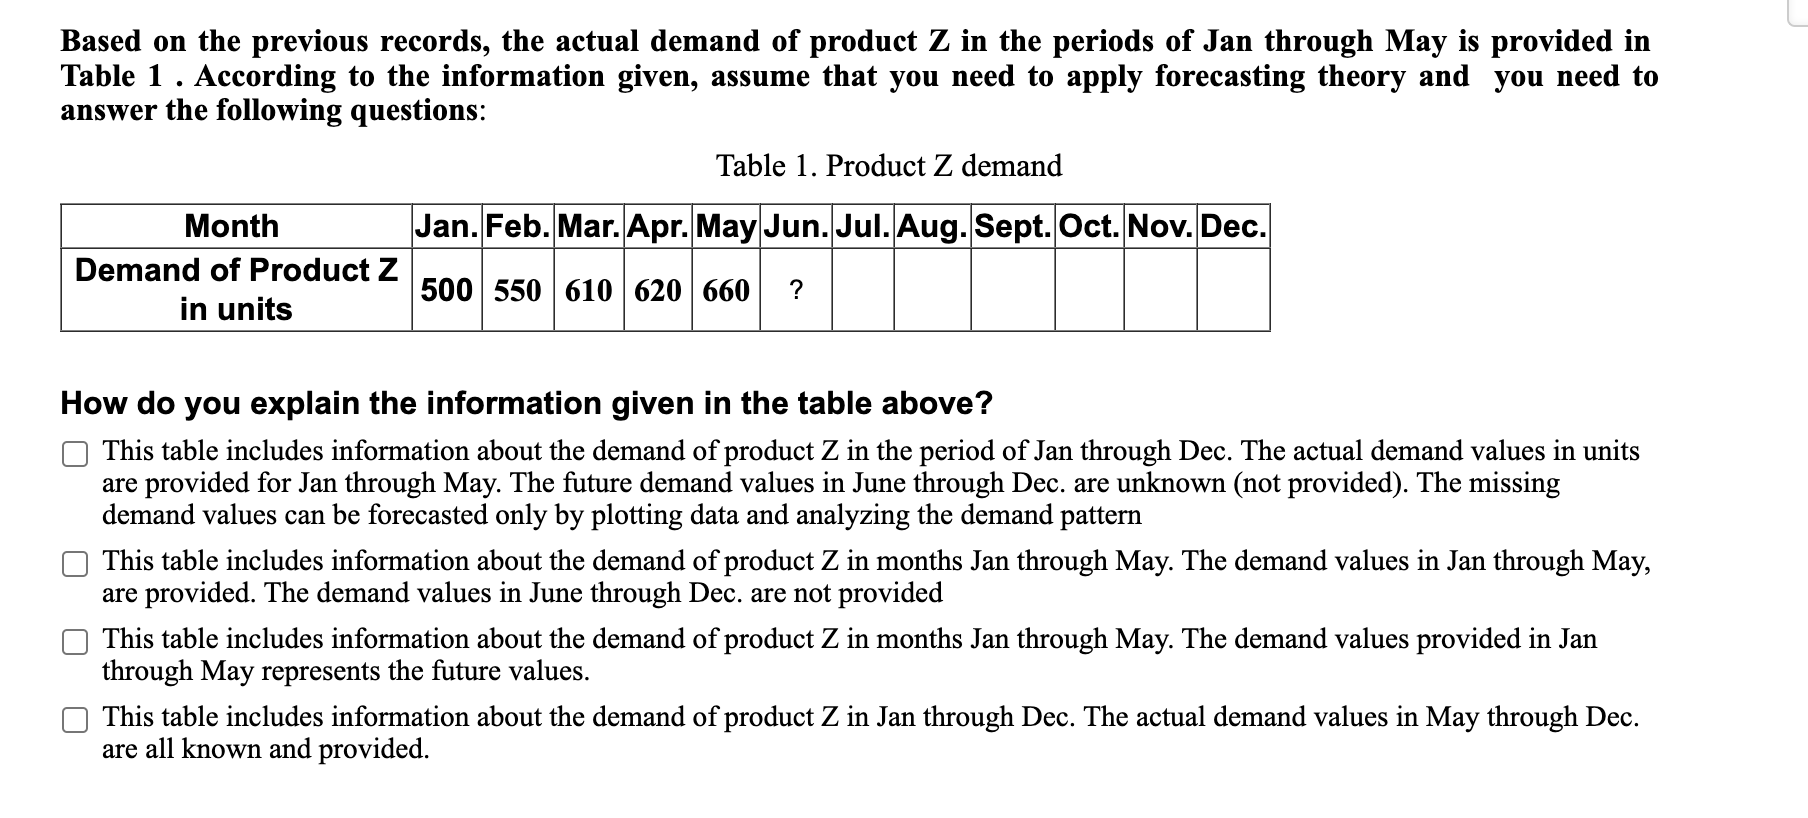
Select the correct choice which shows your ability to make assumptions in your analysis Based on the analysis, the linear trend model is considered as the best model to forecast demand in June. It can be assumed that the future demand values in July and onward will follow the same analysis. For example, the forecast demand in July is expected to include 39 units more than forecast demand in June. In other words, each future demand value will be increased considering the month index, positive slope and the fixed intercept of the linear trend forecasting model (e.g., expected demand in August is 783 units and December is 939 units Based on the analysis, the linear trend model is considered as the best model to forecast demand in June. It can be assumed that the demand in July will be increased by the amount of slope of the model compared to the forecast demand in June. If demand in June is expected to be 705 units, the demand in July will be 705 +39=744 units. Same applies on future months Based on the analysis, the linear trend model is considered as the best model to forecast demand in June. As the demand in June is decreased compared to the actual demand in May, the demand in July is assumed to be decreasing too. In other words, each future demand value will be increased considering the month index, positive slope and the fixed intercept of the linear trend forecasting model. Also, it can be assumed that since the forecast demand in June is based on the average of all previous months and tends to be decreasing compared to actual demand in May, the demand values in future months will be up and down around the average. Based on the analysis, the linear trend model or averaging model are not considered as the best model to forecast demand in June. It is assumed that demand in June and July will be unknown since data is not valid for any forecasting. QUESTION 6 Select the choice that supports your arguments by showing quantitative evidence The forecast demands in months July through Dec are 744,783,822,822,861,900 and 939, respectively. These findings support the argument that there will be an increase in the expected demand form one month to another based on the linear trend model The forecast demands in months July through Dec are 606,617,618,618,610,613 and 615, respectively. These findings support the argument that averaging model is the best to use; therefore, future demand values tend to be fluctuating around the average. Also, another evidence showing the decreasing trend are the values of demand in July through Dec and they are 198,159,120,81,42 and 3 respectively Since the data is considered invalid to use for forecasting, quantitative evidence cannot be provided Calculate the forecast demand in June using the appropriate forecasting/mathematical model 705 588 None of them QUESTION 4 Which of the following choices would represent appropriate conclusions you have drawn based on the captured quantitative results or analysis? It can be included that the actual demand data shows a trend demand pattern. Therefore, the demand value of June is determined by a linear trend forecasting model. Forecast demand in June is 705 units and this exceeds the actual demand in May by 45 units more. It can be concluded that the forecast demand in June has increased to 705 when using the linear trend forecasting model It can be included that the actual demand data shows either horizontal pattern or a decreasing trend pattern. Therefore, the forecast of June shows that demand is decreased compared to actual demand in May when using the linear trend forecasting model or the averaging techniques. For example, the expected demand in June which is 588 using simple moving average model is less than actual demand in May It can be included that the actual demand data does not show any demand pattern. To forecast the demand value in June, the relevant information can be converted into the following forecasting equation F(t) = Intercept + Slope *t where t = 6, June has a month index of 6 F(t) = Intercept + Slope *t where t refers to June period F(t) Actual demand = in = 1,2,3,... t refers to June period n F(t) # Intercept + slope *t F(t) = Actual demand ,n= 1,2,3,... = n Based on the previous records, the actual demand of product Z in the periods of Jan through May is provided in Table 1. According to the information given, assume that you need to apply forecasting theory and you need to answer the following questions: Table 1. Product Z demand Month Jan. Feb. Mar. Apr. May Jun. Jul. Aug. Sept. Oct. Nov. Dec. Demand of Product Z 500 550 610 620 660 in units How do you explain the information given in the table above? This table includes information about the demand of product Z in the period of Jan through Dec. The actual demand values in units are provided for Jan through May. The future demand values in June through Dec. are unknown (not provided). The missing demand values can be forecasted only by plotting data and analyzing the demand pattern This table includes information about the demand of product Z in months Jan through May. The demand values in Jan through May, are provided. The demand values in June through Dec. are not provided This table includes information about the demand of product Z in months Jan through May. The demand values provided in Jan through May represents the future values. This table includes information about the demand of product Z in Jan through Dec. The actual demand values in May through Dec. are all known and provided


