

Question: Select the data set ChicagoTaxi from StatCrunch (should have 28,606 entries). PART III: Hypothesis Test for a Proportion 3. (10 pts.) Let's look at the
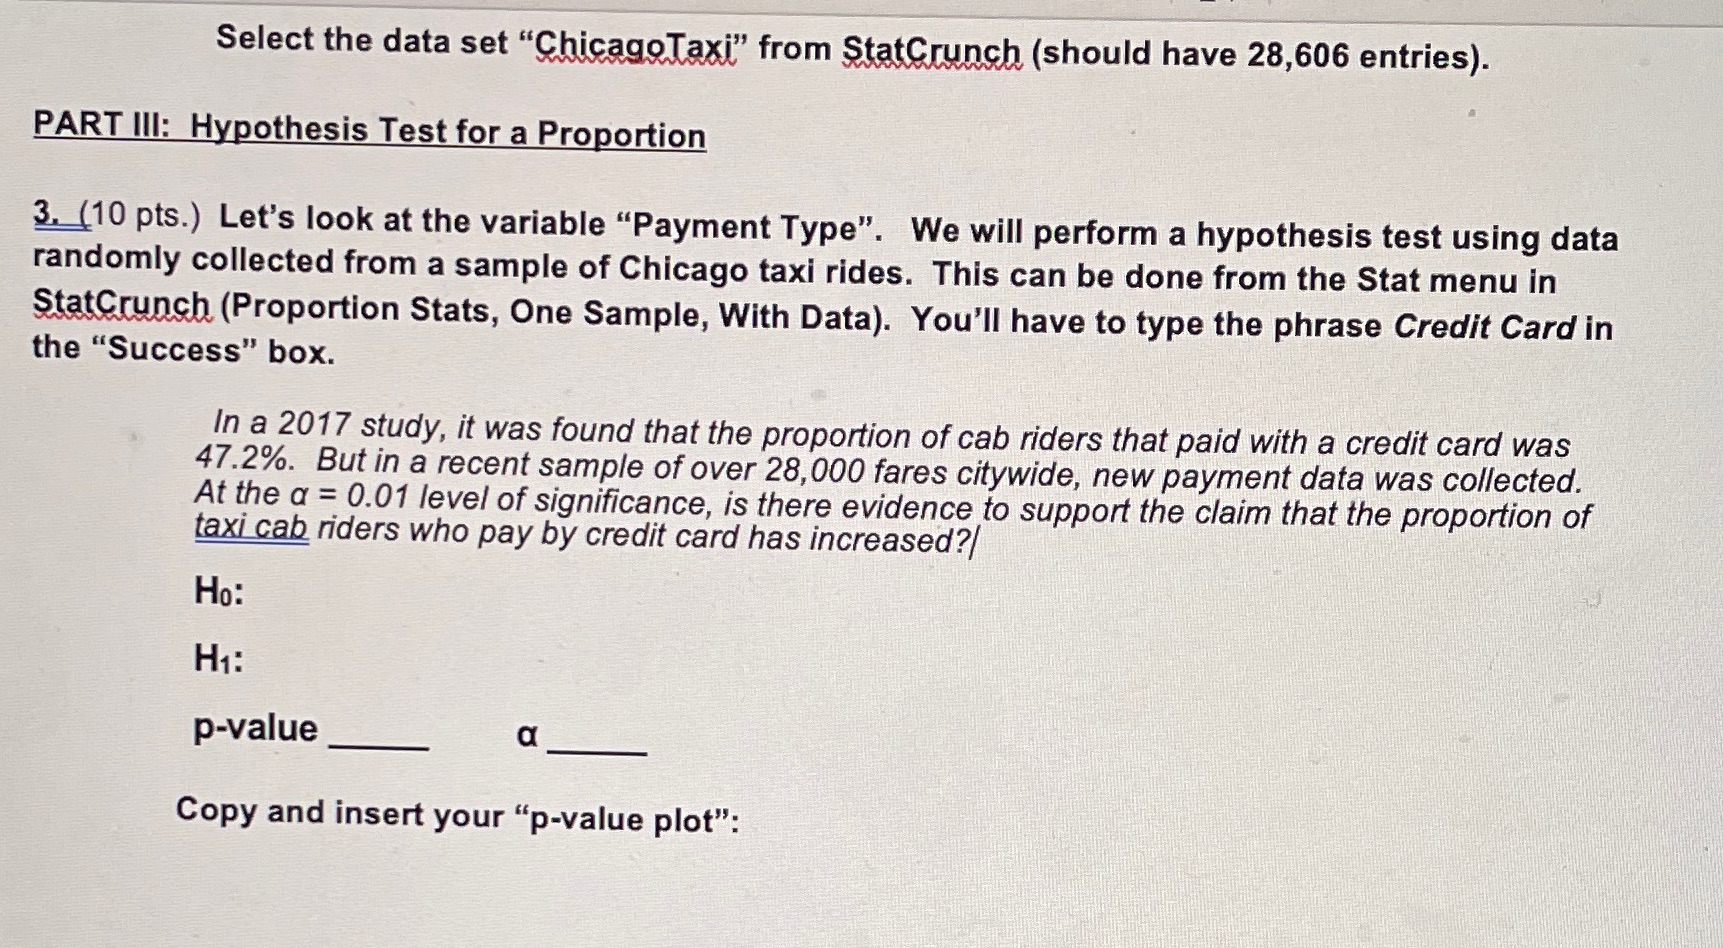
Select the data set "ChicagoTaxi" from StatCrunch (should have 28,606 entries). PART III: Hypothesis Test for a Proportion 3. (10 pts.) Let's look at the variable "Payment Type". We will perform a hypothesis test using data randomly collected from a sample of Chicago taxi rides. This can be done from the Stat menu in StatCrunch (Proportion Stats, One Sample, With Data). You'll have to type the phrase Credit Card in the "Success" box. In a 2017 study, it was found that the proportion of cab riders that paid with a credit card was 47.2%. But in a recent sample of over 28,000 fares citywide, new payment data was collected. At the a = 0.01 level of significance, is there evidence to support the claim that the proportion of taxi cab riders who pay by credit card has increased?/ Ho: H1: p-value a Copy and insert your "p-value plot"
Step by Step Solution
There are 3 Steps involved in it

Get step-by-step solutions from verified subject matter experts