

Question: Select the graph that matches the numbered manufacturing cost data. Indicate by letter which of the graphs best fits each of the situations or items
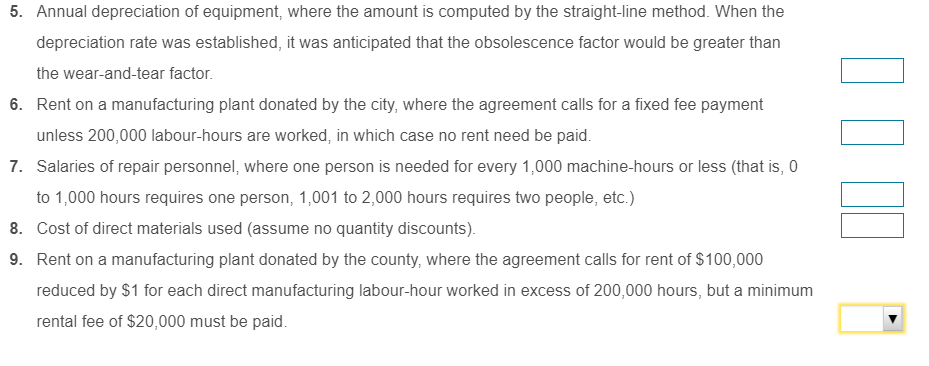
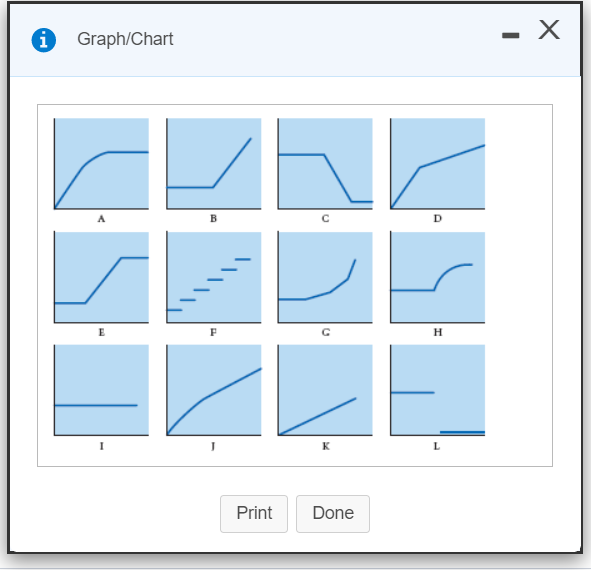
Select the graph that matches the numbered manufacturing cost data. Indicate by letter which of the graphs best fits each of the situations or items described.
5. Annual depreciation of equipment, where the amount is computed by the straight-line method. When the depreciation rate was established, it was anticipated that the obsolescence factor would be greater than the wear-and-tear factor. 6. Rent on a manufacturing plant donated by the city, where the agreement calls for a fixed fee payment unless 200,000 labour-hours are worked, in which case no rent need be paid. 7. Salaries of repair personnel, where one person is needed for every 1,000 machine-hours or less (that is, 0 to 1,000 hours requires one person, 1,001 to 2,000 hours requires two people, etc.) 8. Cost of direct materials used (assume no quantity discounts). 9. Rent on a manufacturing plant donated by the county, where the agreement calls for rent of $100,000 reduced by $1 for each direct manufacturing labour-hour worked in excess of 200,000 hours, but a minimum rental fee of $20,000 must be paid. to' * Graph/Chart ur Print Done
Step by Step Solution
There are 3 Steps involved in it

Get step-by-step solutions from verified subject matter experts