

Question: Select the two items that are most likely displayed in this graph. (Note the answer items may be in pseudocode) 0.15 0.1 0.05 0 500
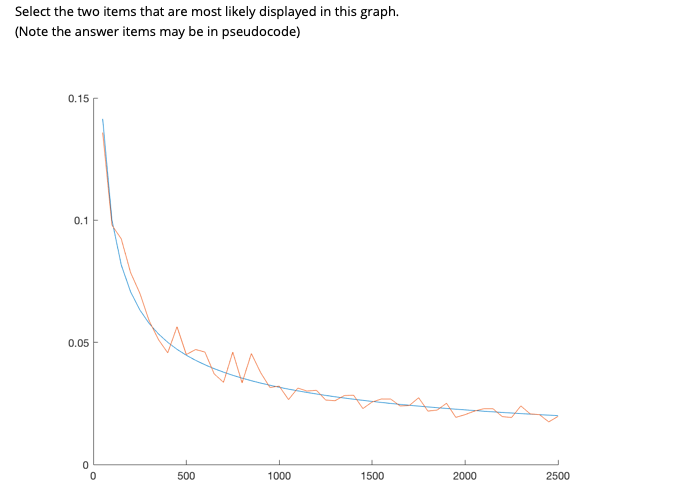
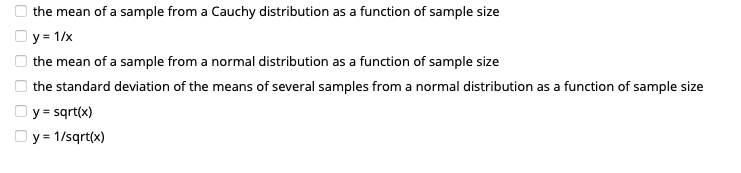
Select the two items that are most likely displayed in this graph. (Note the answer items may be in pseudocode) 0.15 0.1 0.05 0 500 1000 1500 2000 2500O the mean of a sample from a Cauchy distribution as a function of sample size O y = 1/x O the mean of a sample from a normal distribution as a function of sample size O the standard deviation of the means of several samples from a normal distribution as a function of sample size O y = sqrt(x) O y = 1/sqrt(x)
Step by Step Solution
There are 3 Steps involved in it
1 Expert Approved Answer
Step: 1 Unlock

Question Has Been Solved by an Expert!
Get step-by-step solutions from verified subject matter experts
Step: 2 Unlock
Step: 3 Unlock