

Question: Select three specific items from the Statement of Cash Flows of Hyundai Motor Company and explain in detail how these items represent the firms performance
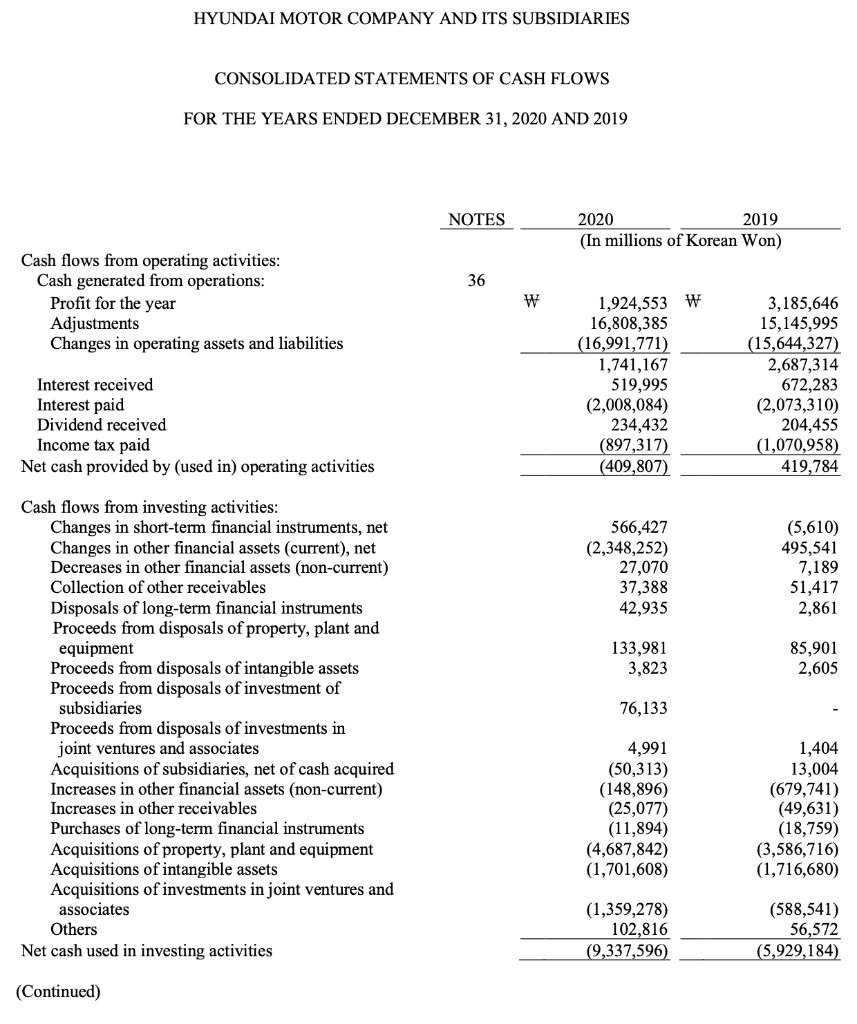
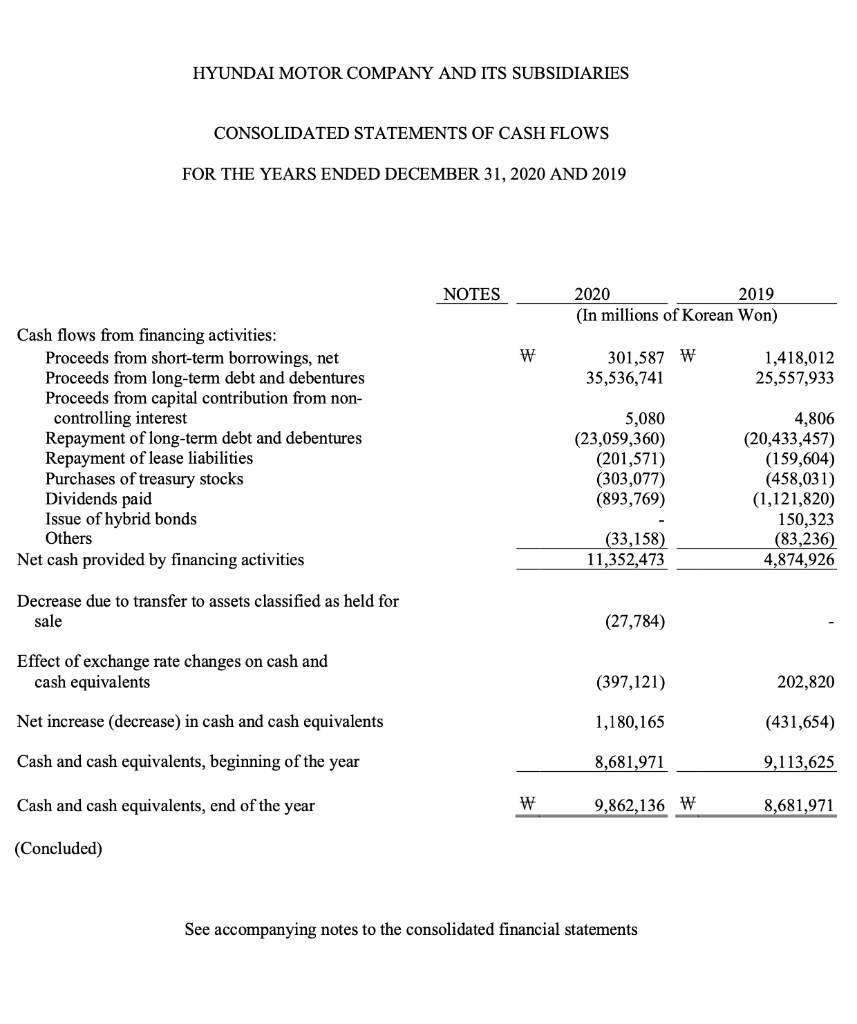
Select three specific items from the Statement of Cash Flows of Hyundai Motor Company and explain in detail how these items represent the firms performance (supporting your explanation with numbers in the financial statement above is required).
Please help me answer this question as much specifically as possible. Thank you so much!
HYUNDAI MOTOR COMPANY AND ITS SUBSIDIARIES CONSOLIDATED STATEMENTS OF CASH FLOWS FOR THE YEARS ENDED DECEMBER 31, 2020 AND 2019 NOTES 2020 2019 (In millions of Korean Won) 36 Cash flows from operating activities: Cash generated from operations: Profit for the year Adjustments Changes in operating assets and liabilities w Interest received Interest paid Dividend received Income tax paid Net cash provided by (used in) operating activities 1,924,553 W 16,808,385 (16,991,771) 1,741,167 519,995 (2,008,084) 234,432 (897,317) (409,807) 3,185,646 15,145,995 (15,644,327) 2,687,314 672,283 (2,073,310) 204,455 (1,070,958) 419,784 566,427 (2,348,252) 27,070 37,388 42,935 (5,610) 495,541 7,189 51,417 2,861 133,981 3,823 85,901 2,605 76,133 Cash flows from investing activities: Changes in short-term financial instruments, net Changes in other financial assets (current), net Decreases in other financial assets (non-current) Collection of other receivables Disposals of long-term financial instruments Proceeds from disposals of property, plant and equipment Proceeds from disposals of intangible assets Proceeds from disposals of investment of subsidiaries Proceeds from disposals of investments in joint ventures and associates Acquisitions of subsidiaries, net of cash acquired Increases in other financial assets (non-current) Increases in other receivables Purchases of long-term financial instruments Acquisitions of property, plant and equipment Acquisitions of intangible assets Acquisitions of investments in joint ventures and associates Others Net cash used in investing activities 4,991 (50,313) (148,896) (25,077) (11,894) (4,687,842) (1,701,608) 1,404 13,004 (679,741) (49,631) (18,759) (3,586,716) (1,716,680) (1,359,278) 102,816 (9,337,596) (588,541) 56,572 (5,929,184) (Continued) HYUNDAI MOTOR COMPANY AND ITS SUBSIDIARIES CONSOLIDATED STATEMENTS OF CASH FLOWS FOR THE YEARS ENDED DECEMBER 31, 2020 AND 2019 NOTES 2020 2019 (In millions of Korean Won) W 301,587 W 35,536,741 1,418,012 25,557,933 Cash flows from financing activities: Proceeds from short-term borrowings, net Proceeds from long-term debt and debentures Proceeds from capital contribution from non- controlling interest Repayment of long-term debt and debentures Repayment of lease liabilities Purchases of treasury stocks Dividends paid Issue of hybrid bonds Others Net cash provided by financing activities 5,080 (23,059,360) (201,571) (303,077) (893,769) 4,806 (20,433,457) (159,604) (458,031) (1,121,820) 150,323 (83,236) 4,874,926 (33,158) 11,352,473 Decrease due to transfer to assets classified as held for sale (27,784) Effect of exchange rate changes on cash and cash equivalents (397,121) 202,820 Net increase (decrease) in cash and cash equivalents 1,180,165 (431,654) Cash and cash equivalents, beginning of the year 8,681,971 9,113,625 Cash and cash equivalents, end of the year W 9,862,136 W 8,681,971 (Concluded) See accompanying notes to the consolidated financial statements HYUNDAI MOTOR COMPANY AND ITS SUBSIDIARIES CONSOLIDATED STATEMENTS OF CASH FLOWS FOR THE YEARS ENDED DECEMBER 31, 2020 AND 2019 NOTES 2020 2019 (In millions of Korean Won) 36 Cash flows from operating activities: Cash generated from operations: Profit for the year Adjustments Changes in operating assets and liabilities w Interest received Interest paid Dividend received Income tax paid Net cash provided by (used in) operating activities 1,924,553 W 16,808,385 (16,991,771) 1,741,167 519,995 (2,008,084) 234,432 (897,317) (409,807) 3,185,646 15,145,995 (15,644,327) 2,687,314 672,283 (2,073,310) 204,455 (1,070,958) 419,784 566,427 (2,348,252) 27,070 37,388 42,935 (5,610) 495,541 7,189 51,417 2,861 133,981 3,823 85,901 2,605 76,133 Cash flows from investing activities: Changes in short-term financial instruments, net Changes in other financial assets (current), net Decreases in other financial assets (non-current) Collection of other receivables Disposals of long-term financial instruments Proceeds from disposals of property, plant and equipment Proceeds from disposals of intangible assets Proceeds from disposals of investment of subsidiaries Proceeds from disposals of investments in joint ventures and associates Acquisitions of subsidiaries, net of cash acquired Increases in other financial assets (non-current) Increases in other receivables Purchases of long-term financial instruments Acquisitions of property, plant and equipment Acquisitions of intangible assets Acquisitions of investments in joint ventures and associates Others Net cash used in investing activities 4,991 (50,313) (148,896) (25,077) (11,894) (4,687,842) (1,701,608) 1,404 13,004 (679,741) (49,631) (18,759) (3,586,716) (1,716,680) (1,359,278) 102,816 (9,337,596) (588,541) 56,572 (5,929,184) (Continued) HYUNDAI MOTOR COMPANY AND ITS SUBSIDIARIES CONSOLIDATED STATEMENTS OF CASH FLOWS FOR THE YEARS ENDED DECEMBER 31, 2020 AND 2019 NOTES 2020 2019 (In millions of Korean Won) W 301,587 W 35,536,741 1,418,012 25,557,933 Cash flows from financing activities: Proceeds from short-term borrowings, net Proceeds from long-term debt and debentures Proceeds from capital contribution from non- controlling interest Repayment of long-term debt and debentures Repayment of lease liabilities Purchases of treasury stocks Dividends paid Issue of hybrid bonds Others Net cash provided by financing activities 5,080 (23,059,360) (201,571) (303,077) (893,769) 4,806 (20,433,457) (159,604) (458,031) (1,121,820) 150,323 (83,236) 4,874,926 (33,158) 11,352,473 Decrease due to transfer to assets classified as held for sale (27,784) Effect of exchange rate changes on cash and cash equivalents (397,121) 202,820 Net increase (decrease) in cash and cash equivalents 1,180,165 (431,654) Cash and cash equivalents, beginning of the year 8,681,971 9,113,625 Cash and cash equivalents, end of the year W 9,862,136 W 8,681,971 (Concluded) See accompanying notes to the consolidated financial statements
Step by Step Solution
There are 3 Steps involved in it

Get step-by-step solutions from verified subject matter experts