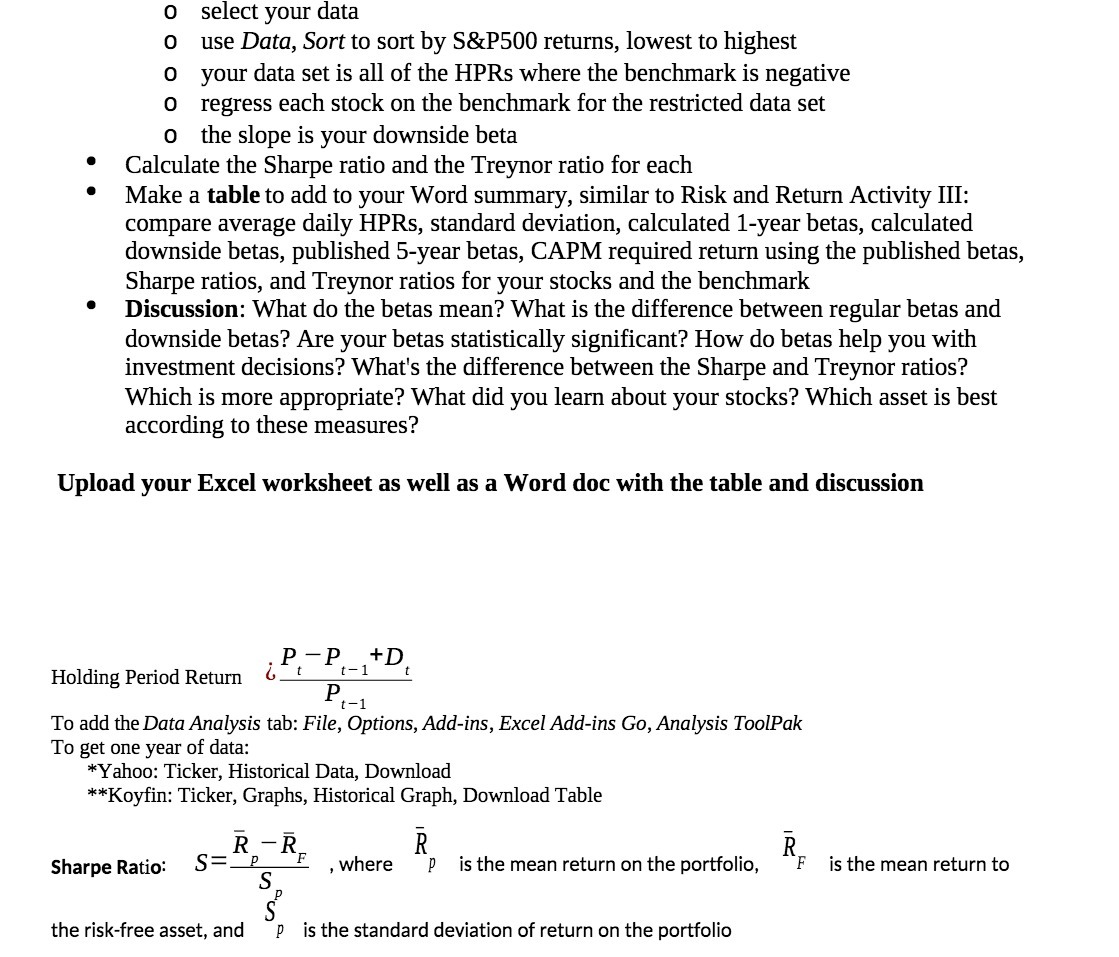
Question: select your data use Data, Sort to sort by S&P500 returns, lowest to highest your data set is all of the HPRs where the benchmark

select your data use Data, Sort to sort by S&P500
select your data use Data, Sort to sort by S&P500 returns, lowest to highest your data set is all of the HPRs where the benchmark is negative regress each stock on the benchmark for the restricted data set 0 the slope is your downside beta " Calculate the Sharpe ratio and the Treynor ratio for each " Make a table to add to your Word summary, similar to Risk and Return Activity III: compare average daily HPRs, standard deviation, calculated 1-year betas, calculated downside betas, published 5-year betas, CAPM required return using the published betas, Sharpe ratios, and Treynor ratios for your stocks and the benchmark " Discussion: What do the betas mean? What is the difference between regular betas and downside betas? Are your betas statistically significant? How do betas help you with investment decisions? What's the difference between the Sharpe and Treynor ratios? Which is more appropriate? What did you learn about your stocks? Which asset is best according to these measures? 0000 Upload your Excel worksheet as well as a Word doc with the table and discussion . P P _ +D Holding Period Return 0 #1: Ptl To add the Data Analysis tab: File, Options, Add-ins, Excel Add-ins Go, Analysis ToolPak To get one year of data: *Yahoo: Ticker, Historical Data, Download **Koyfin: Ticker, Graphs, Historical Graph, Download Table I? R R Sharpe Ratio? 5 Zip'7 . where P is the mean return on the portfolio. F is the mean return to SP 3 the risk-free asset, and P is the standard deviation of return on the portfolio

Step by Step Solution

There are 3 Steps involved in it

1 Expert Approved Answer
Step: 1 Unlock blur-text-image
Question Has Been Solved by an Expert!

Get step-by-step solutions from verified subject matter experts

Step: 2 Unlock
Step: 3 Unlock

Students Have Also Explored These Related Accounting Questions!