

Question: Selected comparative financial statement data for Granger Inc. are shown below. GRANGER INC. Statement of Financial Position (partial) December 31 (in thousands) Current assets
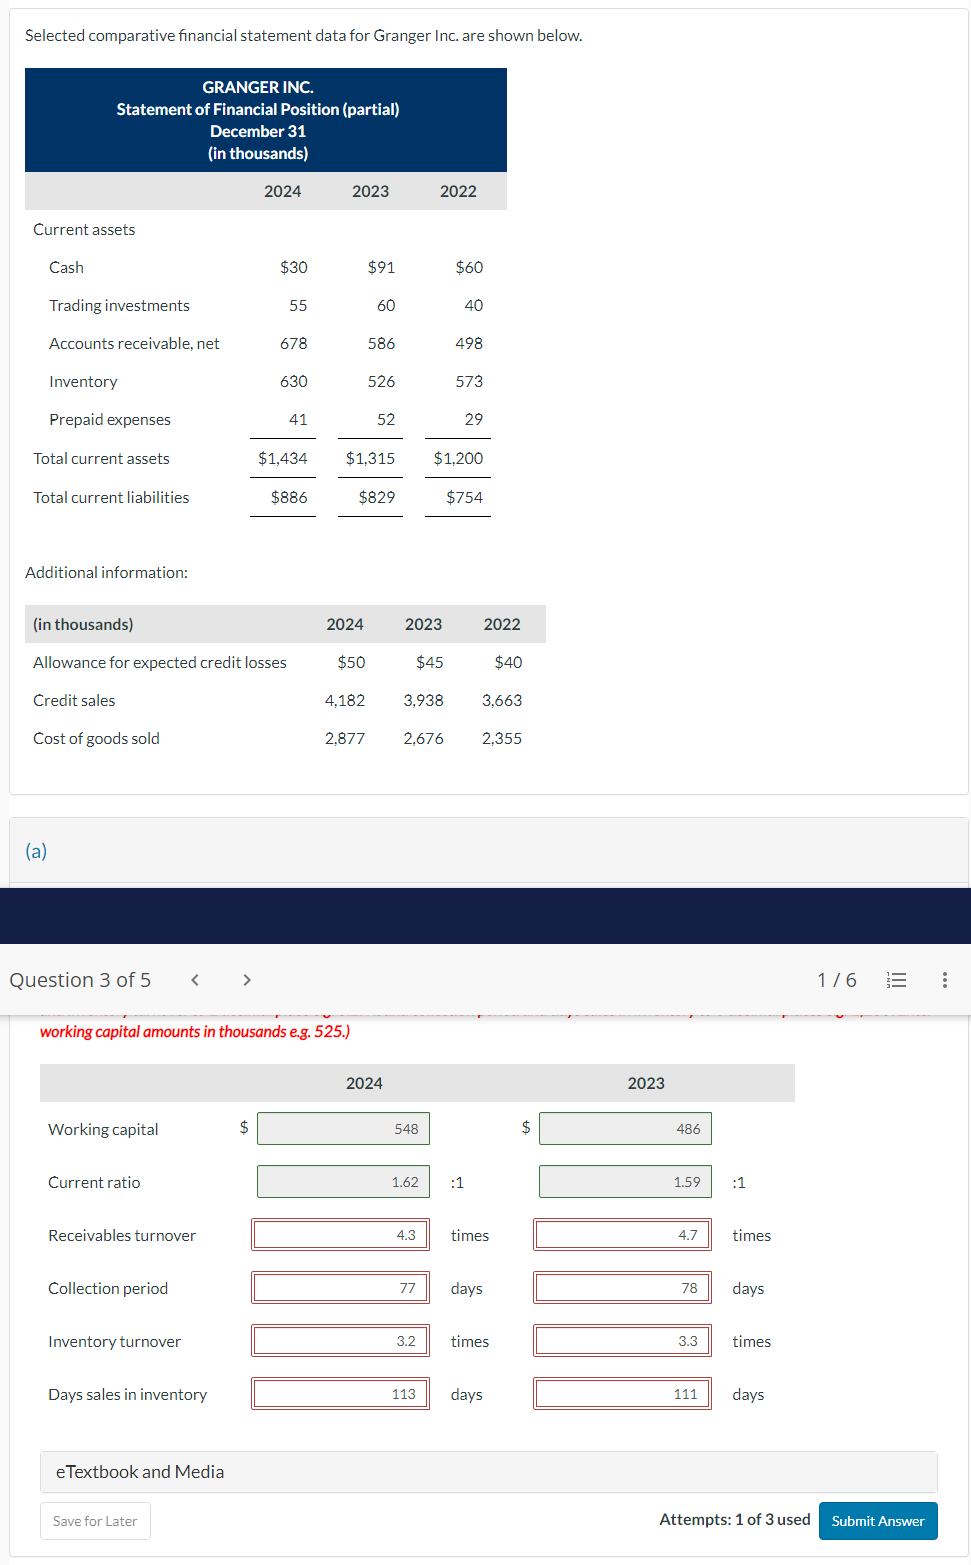
Selected comparative financial statement data for Granger Inc. are shown below. GRANGER INC. Statement of Financial Position (partial) December 31 (in thousands) Current assets 2024 2023 2022 Cash Trading investments $30 55 Accounts receivable, net 678 Inventory 630 Prepaid expenses 41 $60 498 573 Total current assets $1,434 $1,315 $1,200 Total current liabilities $886 $829 $754 Additional information: (in thousands) 2024 2023 2022 Allowance for expected credit losses $50 $45 $40 Credit sales 4.182 3,938 3,663 Cost of goods sold 2.877 2.676 2.355 (a) Question 3 of 5 < > working capital amounts in thousands e.g. 525.) Working capital $ Current ratio Receivables turnover 2024 548 1.62 :1 $ 2023 486 1.59 :1 4.3 times 4.7 times Collection period 77 days 78 days Inventory turnover 3.2 times 3.3 times Days sales in inventory 113 days 111 days eTextbook and Media Save for Later 1/6 III Attempts: 1 of 3 used Submit Answer
Step by Step Solution
There are 3 Steps involved in it

Get step-by-step solutions from verified subject matter experts