

Question: Selected comparative financial statement data for Marx Inc. are shown below. MARX INC. Statement of Financial Position (partial) December 31 (in thousands) 2021 2020 2019
Selected comparative financial statement data for Marx Inc. are shown below.
| MARX INC. Statement of Financial Position (partial) December 31 (in thousands) | |||||||||||
|---|---|---|---|---|---|---|---|---|---|---|---|
| 2021 | 2020 | 2019 | |||||||||
| Current assets | |||||||||||
| Cash | $ | 30 | $ | 91 | $ | 59 | |||||
| Trading investments | 55 | 60 | 40 | ||||||||
| Accounts receivable, net | 678 | 591 | 498 | ||||||||
| Inventory | 627 | 524 | 570 | ||||||||
| Prepaid expenses | 41 | 52 | 29 | ||||||||
| Total current assets | $ | 1,431 | $ | 1,318 | $ | 1,196 | |||||
| Total current liabilities | $ | 870 | $ | 818 | $ | 747 | |||||
Additional information:
| (in thousands) | 2021 | 2020 | 2019 | |||||||
|---|---|---|---|---|---|---|---|---|---|---|
| Allowance for doubtful accounts | $ | 50 | $ | 45 | $ | 40 | ||||
| Credit sales | 4,216 | 3,900 | 3,718 | |||||||
| Cost of goods sold | 2,885 | 2,641 | 2,345 | |||||||
Calculate all possible liquidity ratios for 2021 and 2020. (Round current ratio to 2 decimal places e.g. 2.66. Round receivables turnover and inventory turnover to 1 decimal place e.g. 6.2. Round collection period and days sales in inventory to 0 decimal places e.g. 1,266. Enter working capital amounts in thousands e.g. 525.)
Please answer all those highlighted in RED.
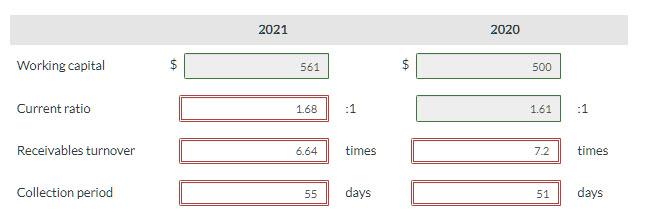
2021 2020 Working capital TA 561 $ 500 Current ratio 1.68 :1 1 1.61 :1 Receivables turnover 6.64 times 72 times Collection period 55 days 51 days
Step by Step Solution
There are 3 Steps involved in it
1 Expert Approved Answer
Step: 1 Unlock

Question Has Been Solved by an Expert!
Get step-by-step solutions from verified subject matter experts
Step: 2 Unlock
Step: 3 Unlock