

Question: Selected comparative financial statement data for Richetti Inc. are shown below. RICHETTI INC. Statement of Financial Position (partial) December 31 (in thousands) Current assets
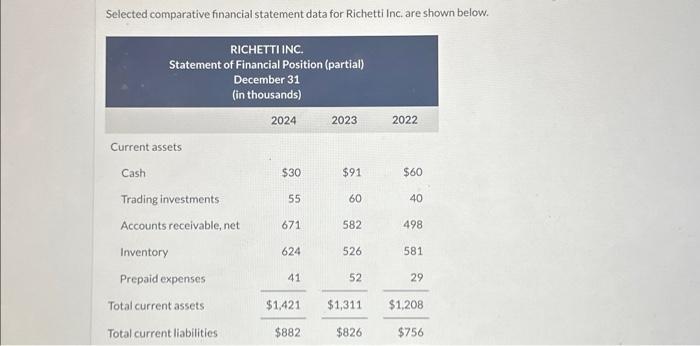

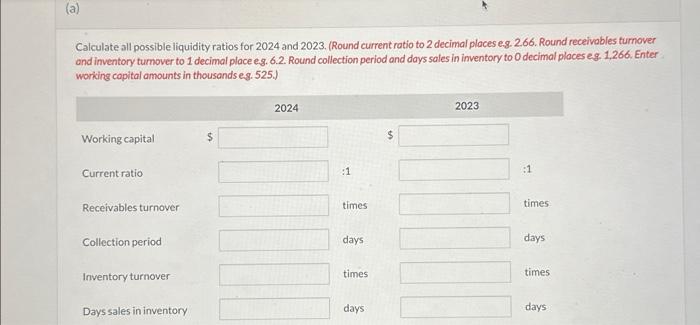
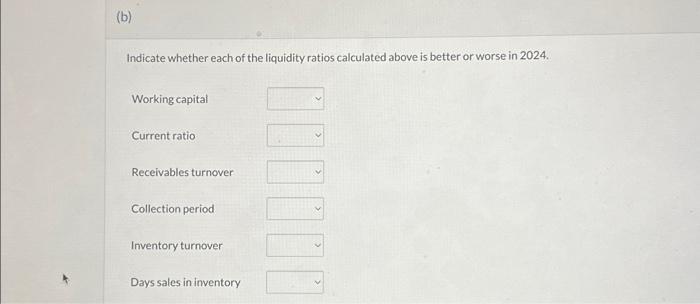
Selected comparative financial statement data for Richetti Inc. are shown below. RICHETTI INC. Statement of Financial Position (partial) December 31 (in thousands) Current assets Cash Trading investments Accounts receivable, net Inventory Prepaid expenses Total current assets Total current liabilities 2024 $30 55 671 624 41 $1,421 $882 2023 $91 60 582 526 52 2022 $60 40 498 581 29 $1,311 $1,208 $826 $756 Additional information: (in thousands) Allowance for expected credit losses Credit sales Cost of goods sold 2024 $50 4,175 2,909 2023 2022 $45 $40 3,901 3,733 2,645 2,364 Calculate all possible liquidity ratios for 2024 and 2023. (Round current ratio to 2 decimal places eg. 2.66. Round receivables turnover and inventory turnover to 1 decimal place e.g. 6.2. Round collection period and days sales in inventory to O decimal places eg. 1,266. Enter working capital amounts in thousands e.g. 525.) Working capital Current ratio Receivables turnover Collection period Inventory turnover Days sales in inventory 2024 :1 times days times days 2023 :1 times days times days (b) Indicate whether each of the liquidity ratios calculated above is better or worse in 2024. Working capital Current ratio Receivables turnover Collection period Inventory turnover Days sales in inventory
Step by Step Solution
There are 3 Steps involved in it
To calculate the liquidity ratios for Richetti Inc for the years 2024 and 2023 well use the provided financial data from the images Lets calculate eac... View full answer

Get step-by-step solutions from verified subject matter experts