

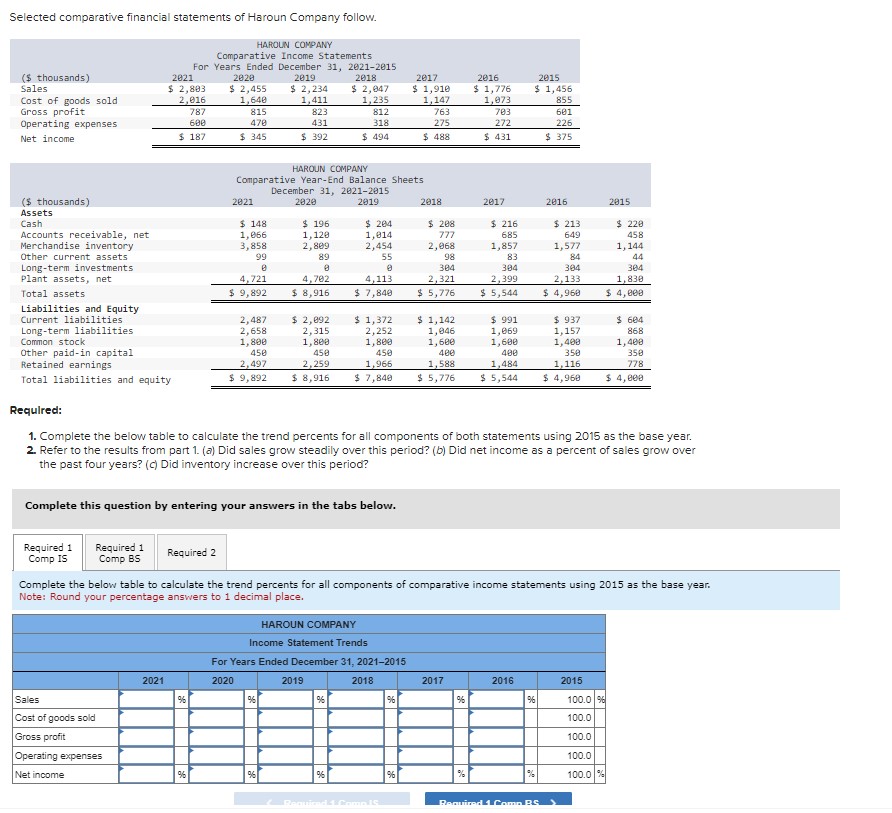
Selected comparative financial statements of Haroun Company follow. HAROUN COMPANY Comparative Income Statements For Years Ended...
Fantastic news! We've Found the answer you've been seeking!
Question:
Expert Answer:

Related Book For 
Posted Date:
