

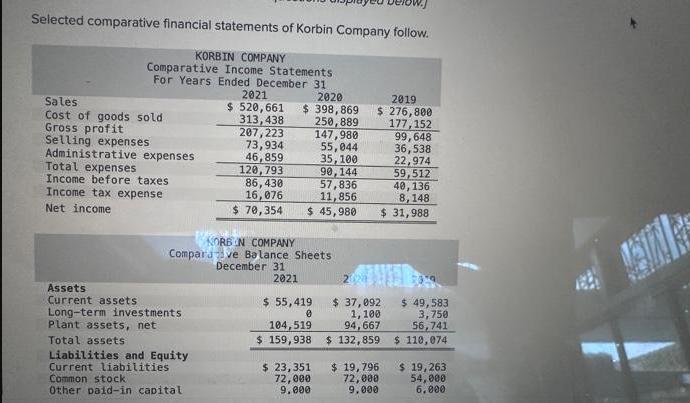
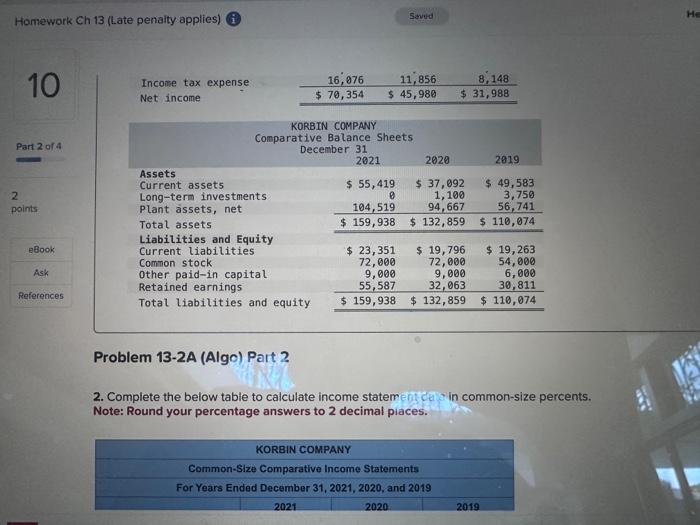
Selected comparative financial statements of Korbin Company follow. KORBIN COMPANY Comparative Income Statements For Years Ended...
Fantastic news! We've Found the answer you've been seeking!
Question:
Expert Answer:
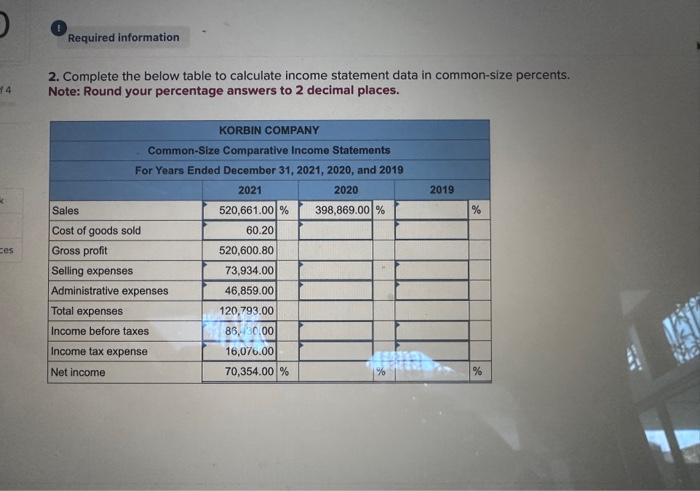
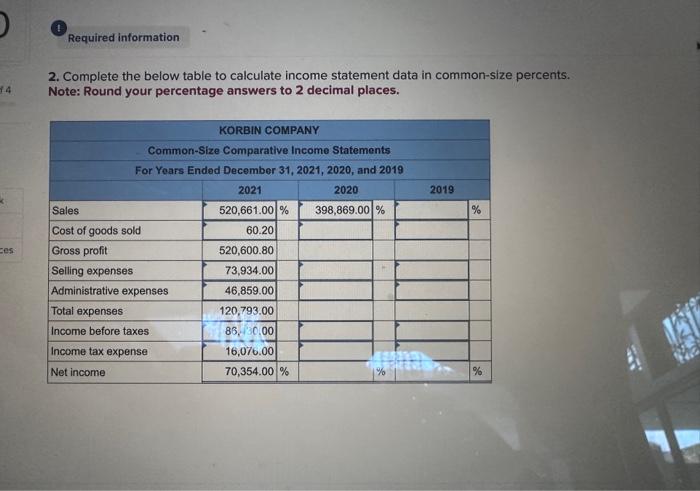
2 Sales Cost of goods sold Gross profit Selling expense Administrative expense Total expense... View the full answer

Related Book For 

Posted Date:
