

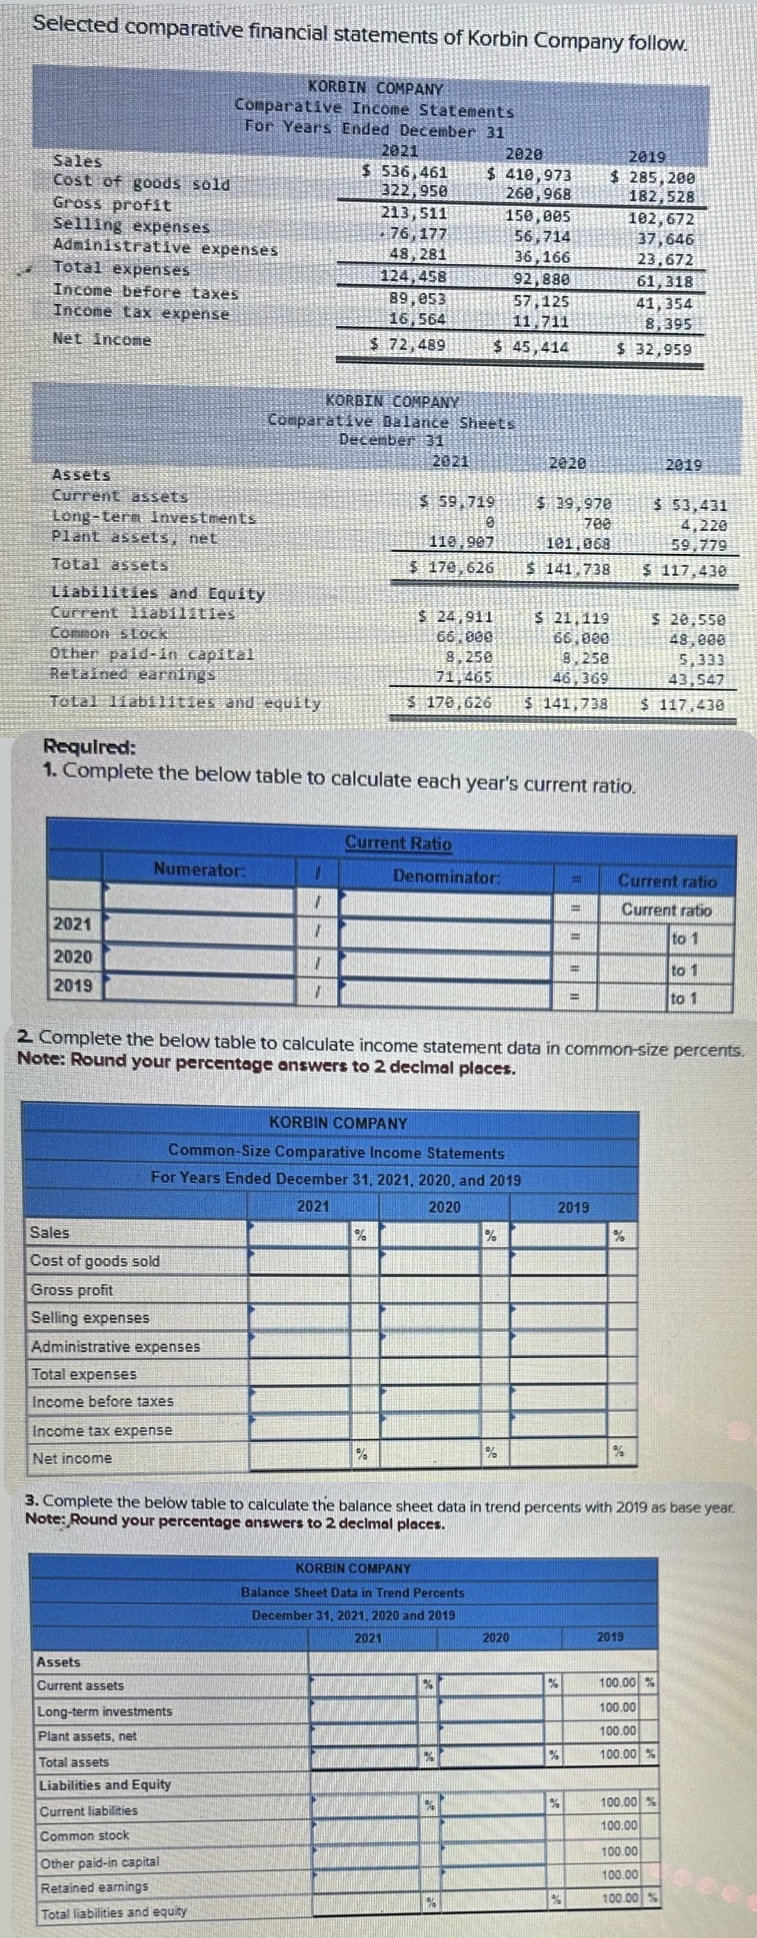
Selected comparative financial statements of Korbin Company follow. Sales Cost of goods sold Gross profit Selling...
Fantastic news! We've Found the answer you've been seeking!
Question:
Expert Answer:
To help you fill in the tables based on the financial statements provided lets go through each part one by one 1 Current Ratio Calculation The current ... View the full answer

Related Book For 
Posted Date:
