

Question: Selected comparative statement data for Blossom Products are presented below. All balance sheet data are as at December 31. 2021 2020 Net sales Cost of
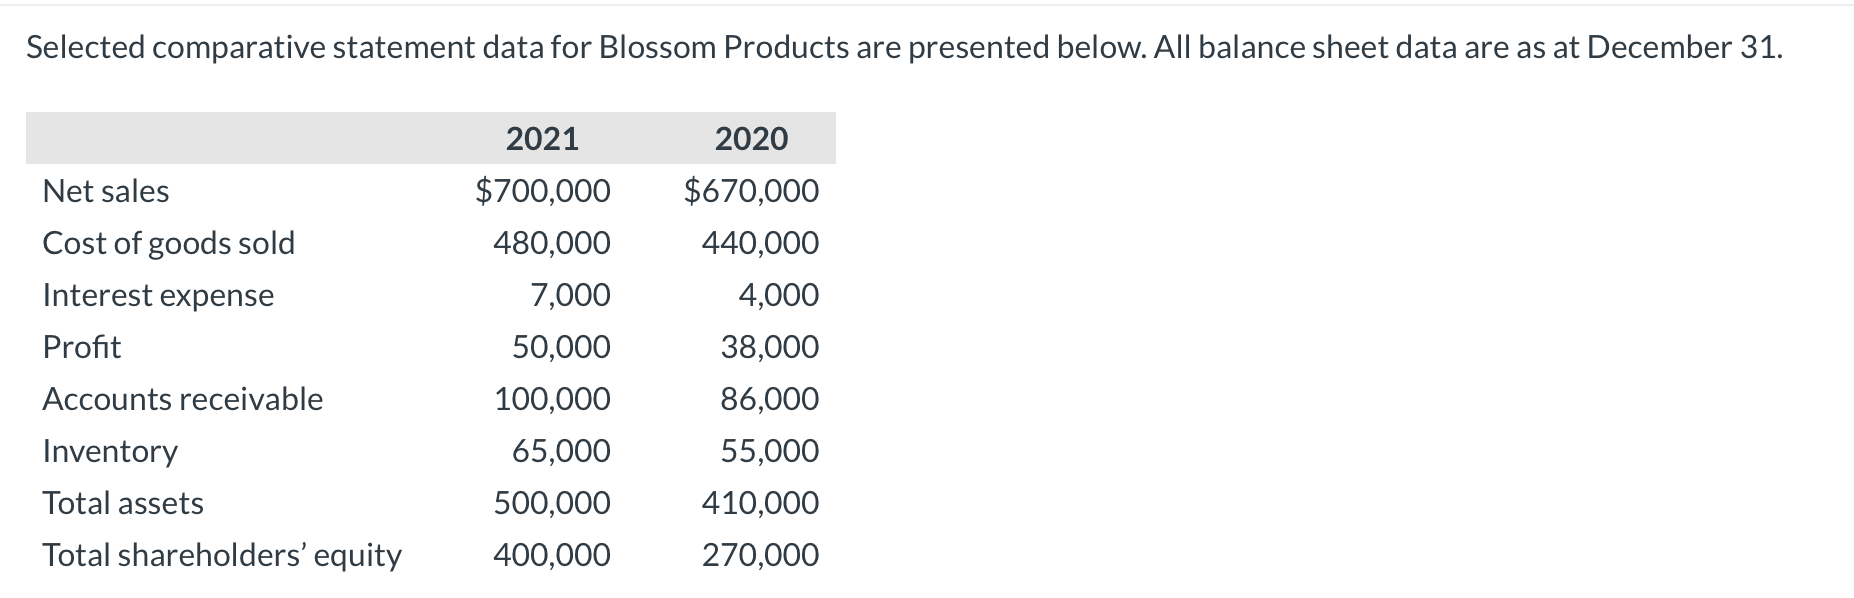
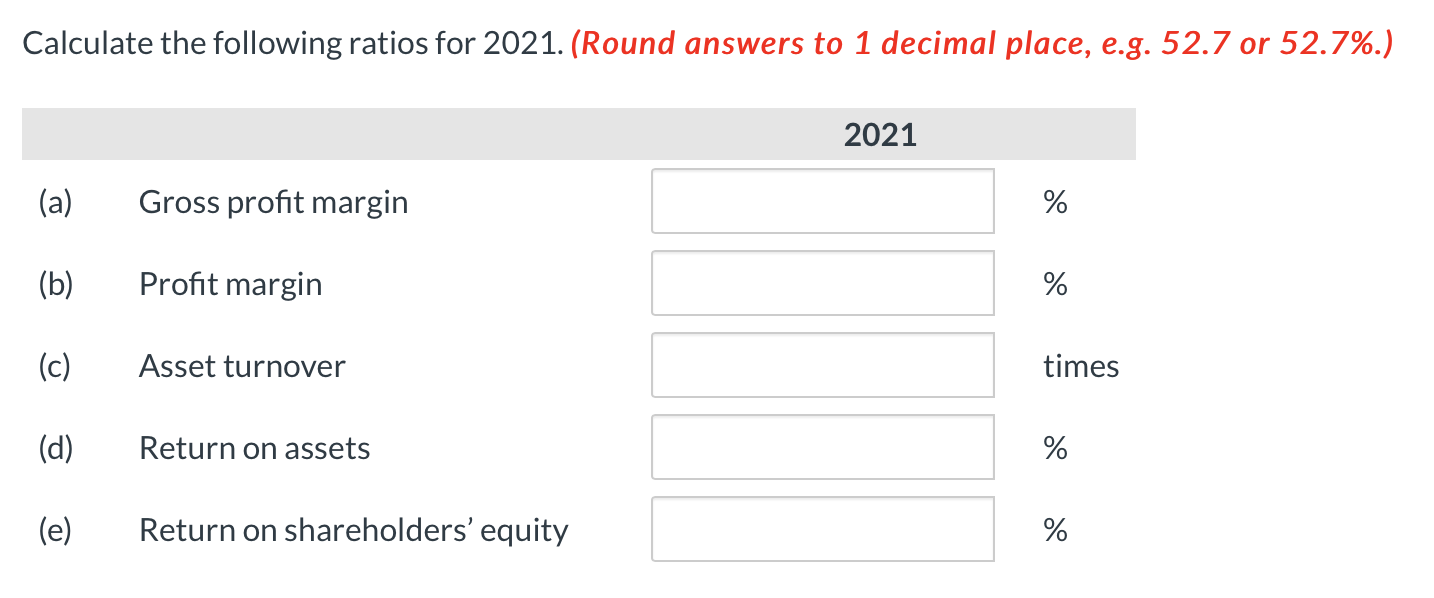
Selected comparative statement data for Blossom Products are presented below. All balance sheet data are as at December 31. 2021 2020 Net sales Cost of goods sold Interest expense Profit $700,000 480,000 7,000 50,000 100,000 65,000 500,000 400,000 $670,000 440,000 4,000 38,000 86,000 55,000 410,000 270,000 Accounts receivable Inventory Total assets Total shareholders' equity Calculate the following ratios for 2021. (Round answers to 1 decimal place, e.g. 52.7 or 52.7%.) 2021 (a) Gross profit margin % (b) Profit margin % (c) Asset turnover times (d) Return on assets % (e) Return on shareholders' equity %
Step by Step Solution
There are 3 Steps involved in it
1 Expert Approved Answer
Step: 1 Unlock

Question Has Been Solved by an Expert!
Get step-by-step solutions from verified subject matter experts
Step: 2 Unlock
Step: 3 Unlock