

Question: Selected 'Comps Average Multiple 45 Perform the Analyses to Support a Relative Valuation 46 (1) Calculate the multiples in rows 60 to 63 for columns
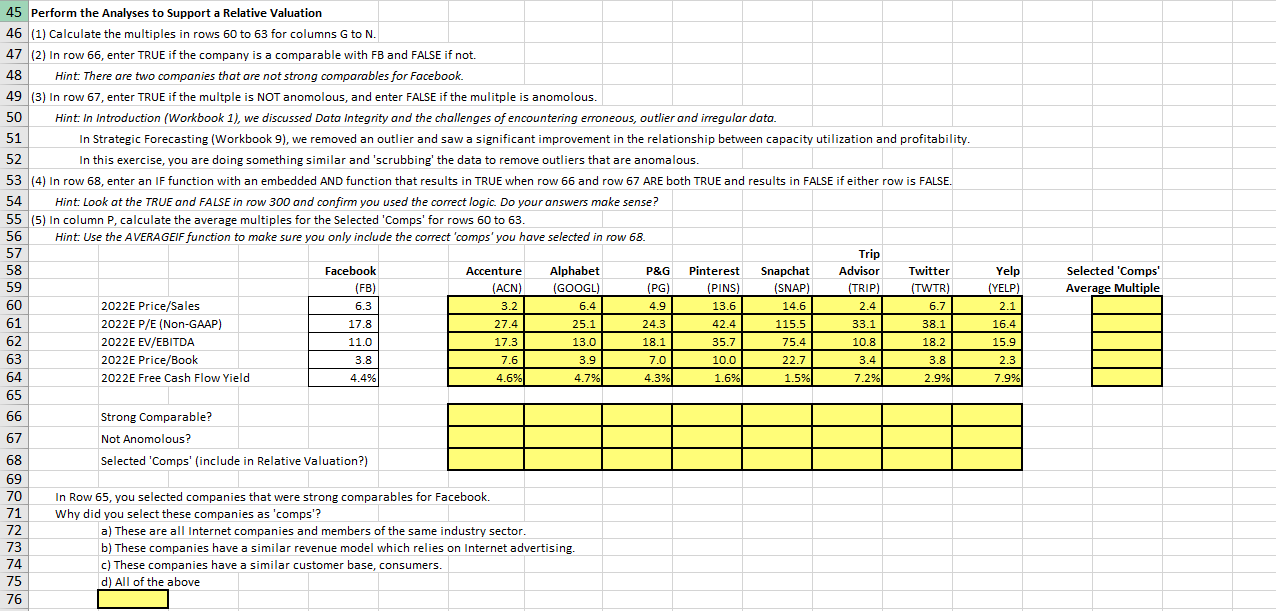
Selected 'Comps Average Multiple 45 Perform the Analyses to Support a Relative Valuation 46 (1) Calculate the multiples in rows 60 to 63 for columns G to N. 47 (2) In row 66, enter TRUE if the company is a comparable with FB and FALSE if not. 48 Hint. There are two companies that are not strong comparables for Facebook. 49 (3) In row 67, enter TRUE if the multple is NOT anomolous, and enter FALSE if the mulitple is anomolous. 50 Hint In Introduction (Workbook 1), we discussed Data Integrity and the challenges of encountering erroneous, outlier and irregular data. 51 In Strategic Forecasting (Workbook 9), we removed an outlier and saw a significant improvement in the relationship between capacity utilization and profitability. 52 In this exercise, you are doing something similar and 'scrubbing' the data to remove outliers that are anomalous. 53 (4) In row 68, enter an IF function with an embedded AND function that results in TRUE when row 66 and row 67 ARE both TRUE and results in FALSE if either row is FALSE. 54 Hint Look at the TRUE and FALSE in row 300 and confirm you used the correct logic. Do your answers make sense? 55 (5) In column P, calculate the average multiples for the Selected 'Comps' for rows 60 to 63. 56 Hint: Use the AVERAGEIF function to make sure you only include the correct 'comps' you have selected in row 68. . 57 Trip 58 Facebook Accenture Alphabet P&G Pinterest Snapchat Advisor Twitter 59 (FB) (ACN) (GOOGL) (PG) PINS) (SNAP) (TRIP) (TWTR) 60 2022E Price/Sales 6.3 3.2 6.4 4.9 13.6 14.6 2.4 61 2022E P/E (Non-GAAP) 17.8 27.4 25.1 24.3 42.4 115.5 33.1 38.1 62 2022E EV/EBITDA 11.0 17.3 13.0 18.1 35.7 75.4 10.8 18.2 63 2022 E Price/Book 3.8 7.6 3.9 7.0 10.0 22.7 3.4 3.8 64 2022 E Free Cash Flow Yield 4.4% 4.6% 4.7% 4.3% 1.6% 1.5% 7.2% 2.9% 65 66 Strong comparable? 67 Not Anomolous? 68 Selected 'Comps' (include in Relative Valuation?) 69 70 In Row 65, you selected companies that were strong comparables for Facebook. 71 Why did you select these companies as 'comps'? 72 a) These are all Internet companies and members of the same industry sector. 73 b) These companies have a similar revenue model which relies on Internet advertising. 74 c) These companies have a similar customer base, consumers. 75 d) All of the above 76 6.7 Yelp (YELP) 2.1 16.4 15.9 2.3 7.9% Selected 'Comps Average Multiple 45 Perform the Analyses to Support a Relative Valuation 46 (1) Calculate the multiples in rows 60 to 63 for columns G to N. 47 (2) In row 66, enter TRUE if the company is a comparable with FB and FALSE if not. 48 Hint. There are two companies that are not strong comparables for Facebook. 49 (3) In row 67, enter TRUE if the multple is NOT anomolous, and enter FALSE if the mulitple is anomolous. 50 Hint In Introduction (Workbook 1), we discussed Data Integrity and the challenges of encountering erroneous, outlier and irregular data. 51 In Strategic Forecasting (Workbook 9), we removed an outlier and saw a significant improvement in the relationship between capacity utilization and profitability. 52 In this exercise, you are doing something similar and 'scrubbing' the data to remove outliers that are anomalous. 53 (4) In row 68, enter an IF function with an embedded AND function that results in TRUE when row 66 and row 67 ARE both TRUE and results in FALSE if either row is FALSE. 54 Hint Look at the TRUE and FALSE in row 300 and confirm you used the correct logic. Do your answers make sense? 55 (5) In column P, calculate the average multiples for the Selected 'Comps' for rows 60 to 63. 56 Hint: Use the AVERAGEIF function to make sure you only include the correct 'comps' you have selected in row 68. . 57 Trip 58 Facebook Accenture Alphabet P&G Pinterest Snapchat Advisor Twitter 59 (FB) (ACN) (GOOGL) (PG) PINS) (SNAP) (TRIP) (TWTR) 60 2022E Price/Sales 6.3 3.2 6.4 4.9 13.6 14.6 2.4 61 2022E P/E (Non-GAAP) 17.8 27.4 25.1 24.3 42.4 115.5 33.1 38.1 62 2022E EV/EBITDA 11.0 17.3 13.0 18.1 35.7 75.4 10.8 18.2 63 2022 E Price/Book 3.8 7.6 3.9 7.0 10.0 22.7 3.4 3.8 64 2022 E Free Cash Flow Yield 4.4% 4.6% 4.7% 4.3% 1.6% 1.5% 7.2% 2.9% 65 66 Strong comparable? 67 Not Anomolous? 68 Selected 'Comps' (include in Relative Valuation?) 69 70 In Row 65, you selected companies that were strong comparables for Facebook. 71 Why did you select these companies as 'comps'? 72 a) These are all Internet companies and members of the same industry sector. 73 b) These companies have a similar revenue model which relies on Internet advertising. 74 c) These companies have a similar customer base, consumers. 75 d) All of the above 76 6.7 Yelp (YELP) 2.1 16.4 15.9 2.3 7.9%
Step by Step Solution
There are 3 Steps involved in it

Get step-by-step solutions from verified subject matter experts