

Question: Selected financial data for Quick Sell, Inc., a retail store, appear as follows. Can someone please help me with this, I am not able to
Selected financial data for Quick Sell, Inc., a retail store, appear as follows.
Can someone please help me with this, I am not able to figure it out. Thanks in advance. :)
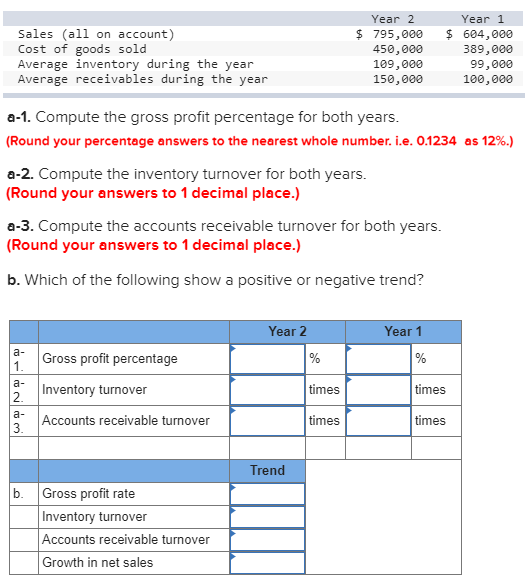
Year 1 604,000 389,000 99,000 100,000 Year 2 Sales (all on account) $. 795,000 Cost of goods sold 450,000 109,000 150,000 Average inventory during the year Average receivables during the year a-1. Compute the gross profit percentage for both years (Round your percentage answers to the nearest whole number. i.e. 0.1234 as 12%.) a-2. Compute the inventory turnover for both years. Round your answers to 1 decimal place.) a-3. Compute the accounts receivable turnover for both years Round your answers to 1 decimal place.) b. Which of the following show a positive or negative trend? Year 2 Year 1 Gross profit percentage Inventory turnover Accounts receivable turnover times times a- times times Trend b. Gross profit rate Inventory turnover Accounts Growth in net sales receivable turnover
Step by Step Solution
There are 3 Steps involved in it

Get step-by-step solutions from verified subject matter experts