

Question: Selected financial data regarding current assets and current liabilities for Ferris Air and Oceanic Airlines are provided as follows: Ferris Air Oceanic Airlines ($ in
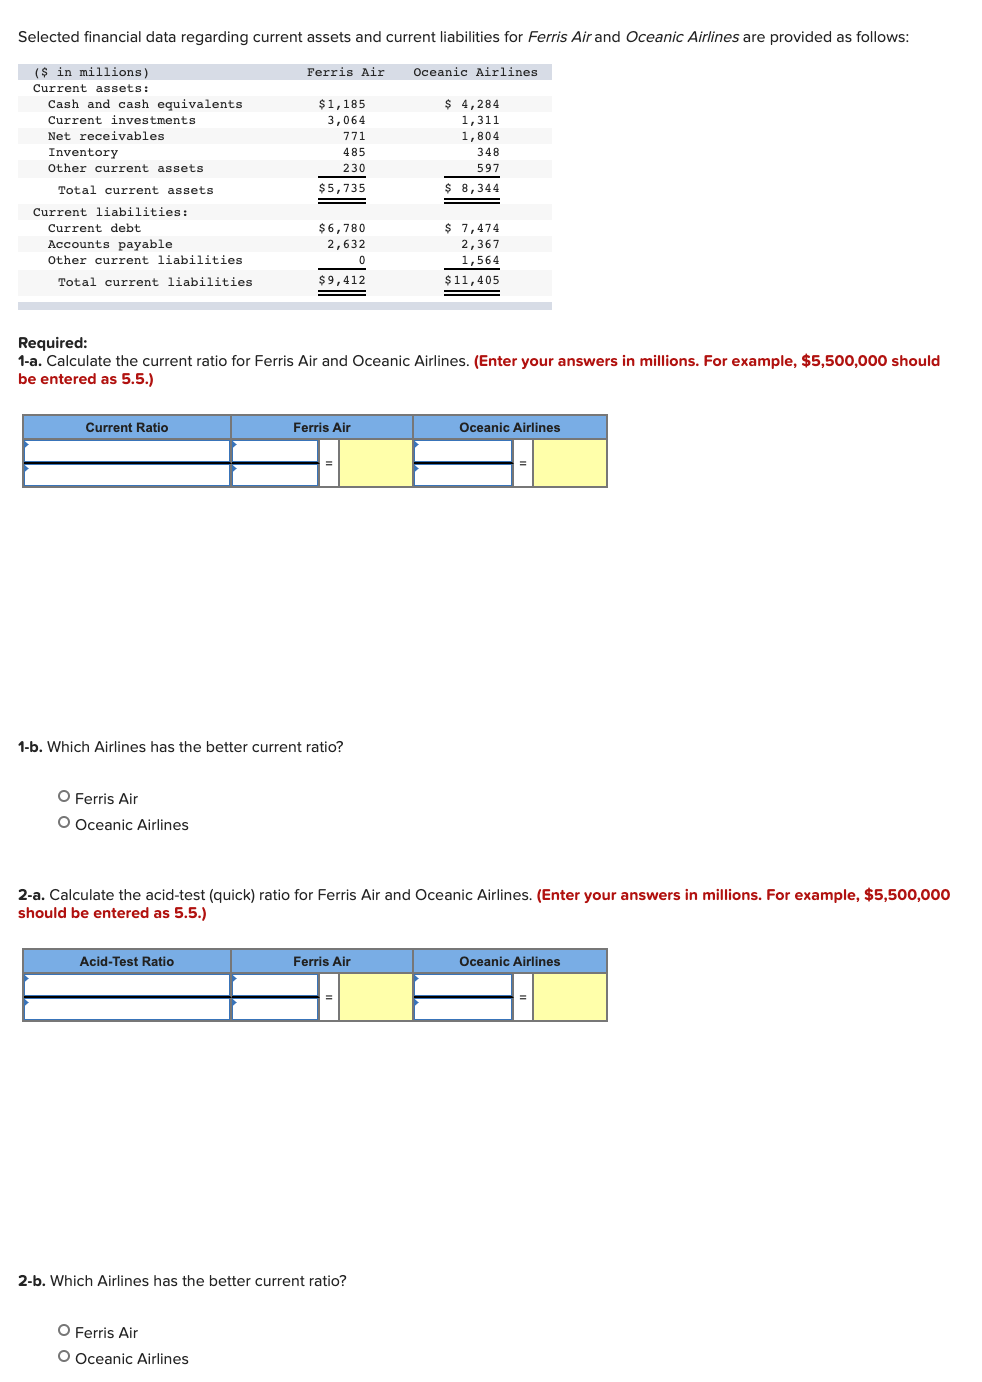
Selected financial data regarding current assets and current liabilities for Ferris Air and Oceanic Airlines are provided as follows: Ferris Air Oceanic Airlines ($ in millions) Current assets: Cash and cash equivalents Current investments Net receivables Inventory Other current assets Total current assets Current liabilities: Current debt Accounts payable Other current liabilities Total current liabilities $1,185 3,064 771 485 230 $ 5,735 $ 4,284 1,311 1,804 348 597 $ 8,344 $6,780 2,632 $ 7,474 2,367 1,564 $11,405 $9,412 Required: 1-a. Calculate the current ratio for Ferris Air and Oceanic Airlines. (Enter your answers in millions. For example, $5,500,000 should be entered as 5.5.) Current Ratio Ferris Air Oceanic Airlines 1-b. Which Airlines has the better current ratio? O Ferris Air O Oceanic Airlines 2-a. Calculate the acid-test (quick) ratio for Ferris Air and Oceanic Airlines. (Enter your answers in millions. For example, $5,500,000 should be entered as 5.5.) Acid-Test Ratio Ferris Air Oceanic Airlines 2-b. Which Airlines has the better current ratio? O Ferris Air O Oceanic Airlines
Step by Step Solution
There are 3 Steps involved in it

Get step-by-step solutions from verified subject matter experts