

Question: Selected financial statement data for Schmitzer Inc. is shown below: 2018 2017 60,000 48,000 Balance sheet: Inventories Ratios: Gross profit ratio for 2018 Inventory turnover
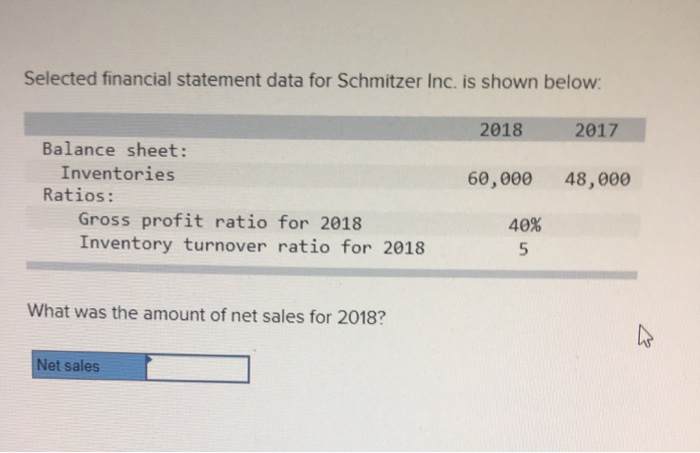
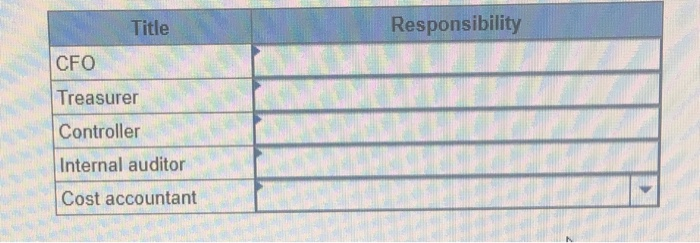
Selected financial statement data for Schmitzer Inc. is shown below: 2018 2017 60,000 48,000 Balance sheet: Inventories Ratios: Gross profit ratio for 2018 Inventory turnover ratio for 2018 40% What was the amount of net sales for 2018? Net sales Responsibility Title CFO Treasurer Controller Internal auditor Cost accountant
Step by Step Solution
There are 3 Steps involved in it
1 Expert Approved Answer
Step: 1 Unlock

Question Has Been Solved by an Expert!
Get step-by-step solutions from verified subject matter experts
Step: 2 Unlock
Step: 3 Unlock