

Question: Selected hypothetical comparative statement data for the giant bookseller Barnes & Noble are presented here. All balance sheet data are as of the end
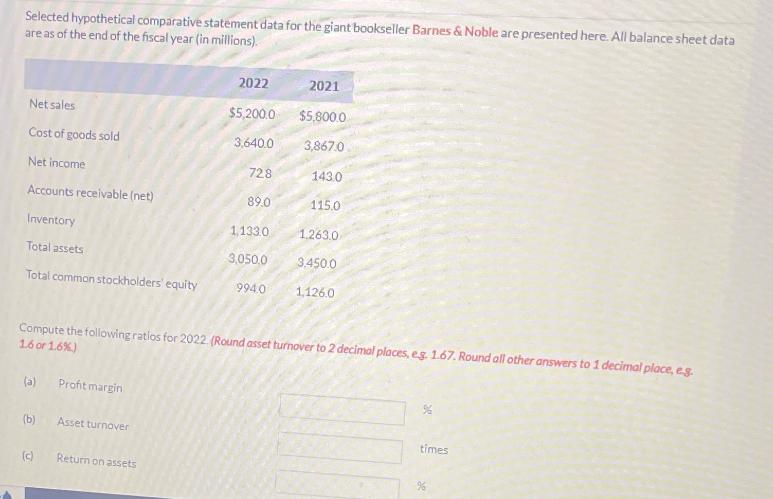
Selected hypothetical comparative statement data for the giant bookseller Barnes & Noble are presented here. All balance sheet data are as of the end of the fiscal year (in millions). Net sales Cost of goods sold Net income Accounts receivable (net) Inventory Total assets Total common stockholders' equity (a) Profit margin (b) Asset turnover (c) 2022 $5,200.0 3,640.0 728 89.0 Compute the following ratios for 2022. (Round asset turnover to 2 decimal places, eg. 1.67. Round all other answers to 1 decimal place, e.g. 1.6 or 1.6%) Return on assets 1,133.0 3,050.0 994.0 2021 $5,800.0 3,867.0 1430 115.0 1.263.0 3.450.0 1,126.0 times
Step by Step Solution
3.44 Rating (154 Votes )
There are 3 Steps involved in it
To calculate the ratios we will use the provided data for 2022 a Profit margin Profit margin is ... View full answer

Get step-by-step solutions from verified subject matter experts