

Question: selects at the end are undervalued or overvalued c. Security market Line D. Security market Line The correct graph is B. Security market Line c.
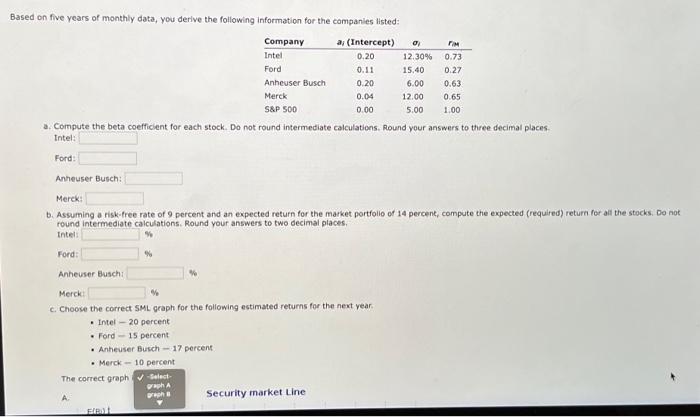
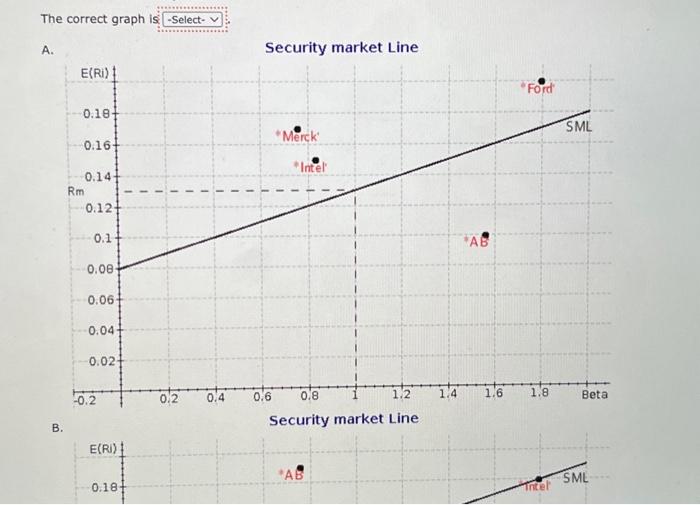
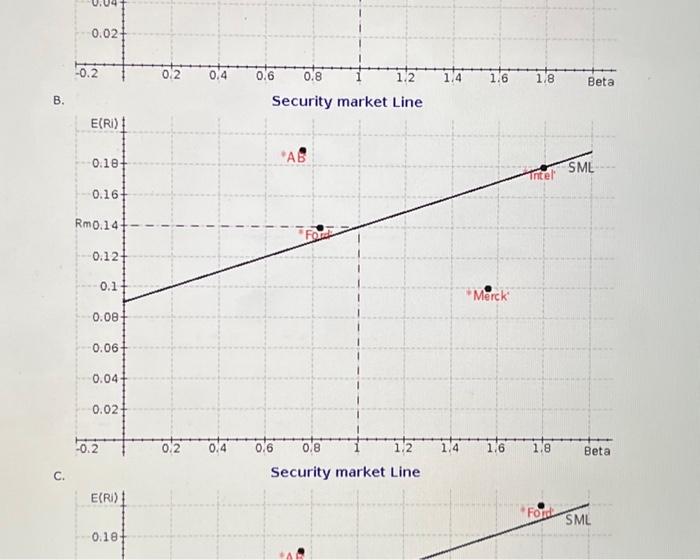
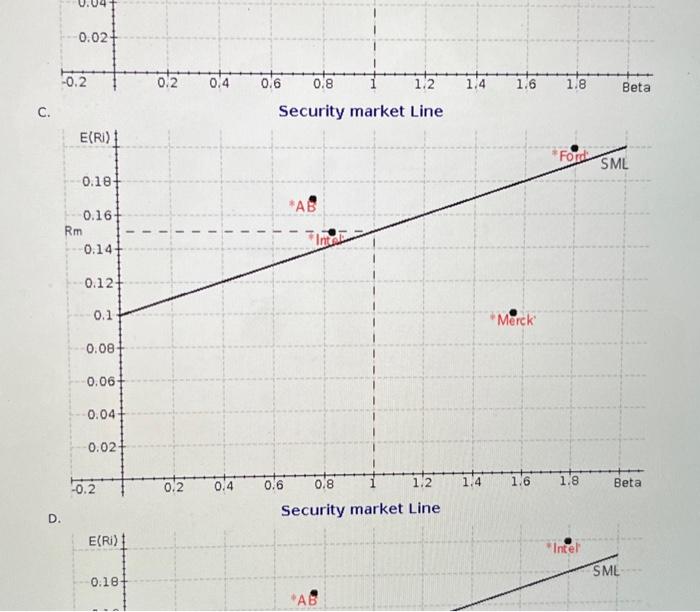
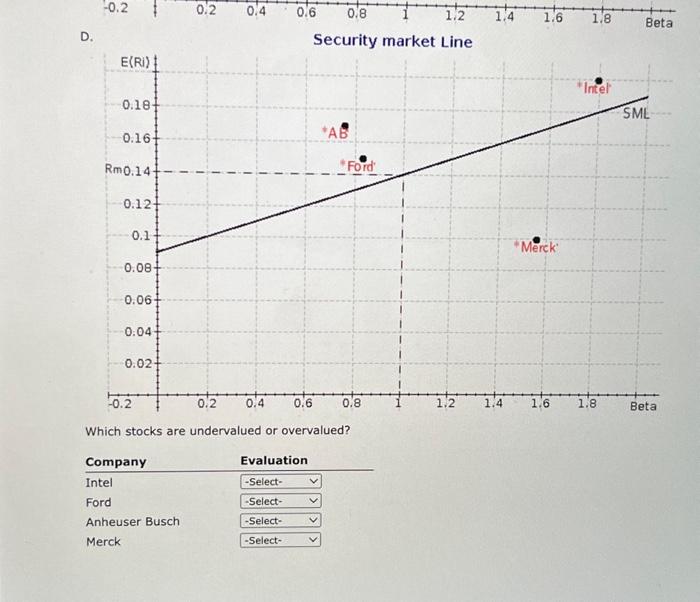
c. Security market Line D. Security market Line The correct graph is B. Security market Line c. Security market Line Based on five years of monthly data, you derive the following information for the companies listed: a. Compute the beta coefficient for each stock. Do not round intermediate calculations. Round your answers to three decimal places. Intel: Ford: Anheuser Busch: Merck: b. Assuming a risk-free rate of 9 percent and an expected return for the market portfolio of 14 percent, compute the expected (required) return for all the stocks. Do not round intermediate calculations. Round your answers to two decimal places. Intel: Ford: Anheuser Eusch: Merck: c. Choose the correct SML graph for the following estimated returns for the next vear. - Inter - 20 percent - Ford - 15 percent - Anheuser Busch - 17 percent - Merck - 10 percent The correct graph A. Which stocks are undervalued or overvalued
Step by Step Solution
There are 3 Steps involved in it

Get step-by-step solutions from verified subject matter experts