

Question: Self-Check Exercise SC 12-1 An instructor is interested in finding out how the number of students absent on a given day is related to the

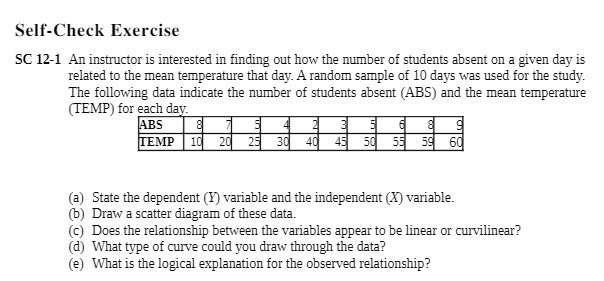
Self-Check Exercise SC 12-1 An instructor is interested in finding out how the number of students absent on a given day is related to the mean temperature that day. A random sample of 10 days was used for the study. The following data indicate the number of students absent (ABS) and the mean temperature (TEMP) for each day. ABS co TEMP 10 20 25 30 40 45 50 55 59 60 (a) State the dependent (Y) variable and the independent (X) variable. (b) Draw a scatter diagram of these data. (c) Does the relationship between the variables appear to be linear or curvilinear? (d) What type of curve could you draw through the data? (e) What is the logical explanation for the observed relationship
Step by Step Solution
There are 3 Steps involved in it

Get step-by-step solutions from verified subject matter experts