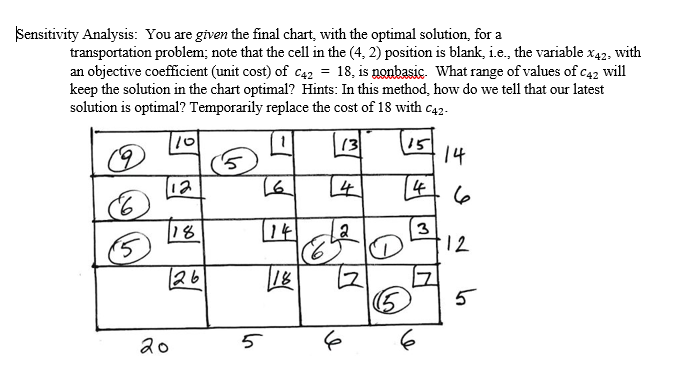
Question: Sensitivity Analysis: You are given the final chart, with the optimal solution, for a transportation problem; note that the cell in the (4, 2) position

Sensitivity Analysis: You are given the final

Sensitivity Analysis: You are given the final chart, with the optimal solution, for a transportation problem; note that the cell in the (4, 2) position is blank, i.e., the variable X42, with an objective coefficient (unit cost) of C42 = 18, is nonbasis. What range of values of C42 will keep the solution in the chart optimal? Hints: In this method, how do we tell that our latest solution is optimal? Temporarily replace the cost of 18 with C42- 131 151 14 12 14 14 6 6 18 14 a 3 5 6 12 126 18 N 15 5 20 5

Step by Step Solution

There are 3 Steps involved in it

1 Expert Approved Answer
Step: 1 Unlock blur-text-image
Question Has Been Solved by an Expert!

Get step-by-step solutions from verified subject matter experts

Step: 2 Unlock
Step: 3 Unlock

Students Have Also Explored These Related General Management Questions!