

Question: Sets Interpreting Venn diagram cardinalities with 3 sets for a real-world... A college food court surveyed 649 students to see how many drink soda, how
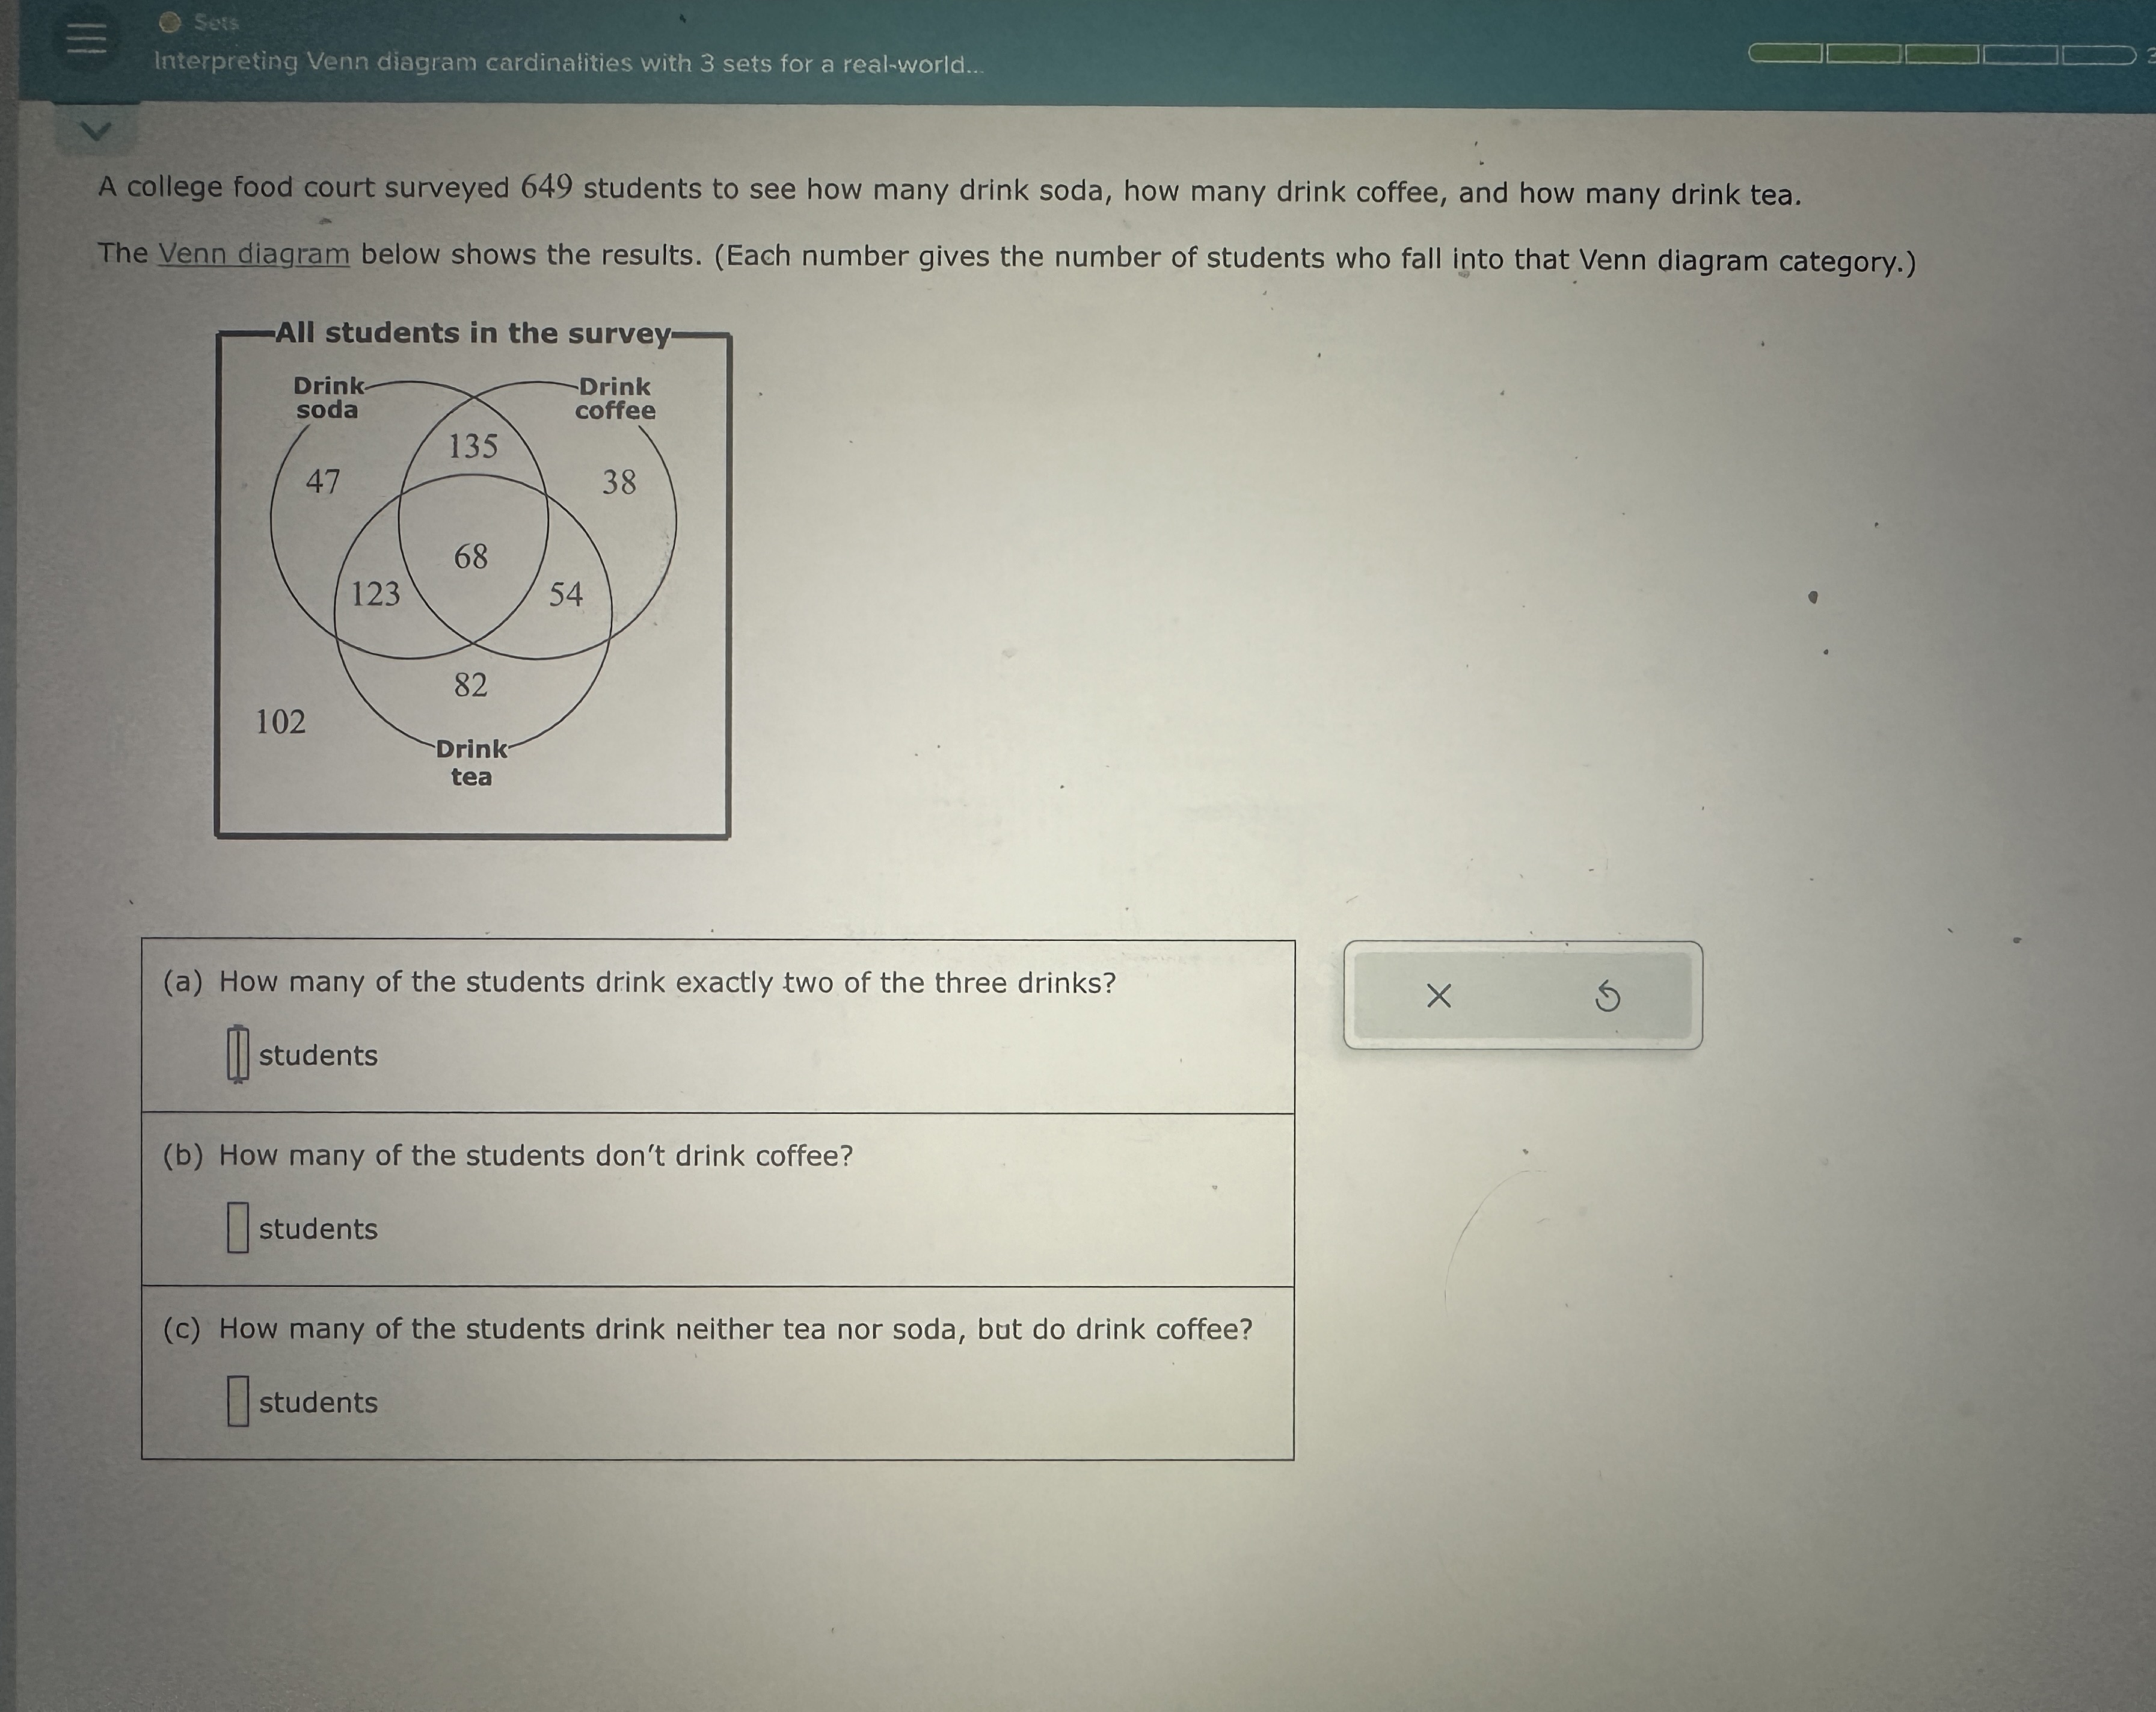
Sets Interpreting Venn diagram cardinalities with 3 sets for a real-world... A college food court surveyed 649 students to see how many drink soda, how many drink coffee, and how many drink tea. The Venn diagram below shows the results. (Each number gives the number of students who fall into that Venn diagram category.) -All students in the survey- Drink- Drink soda coffee 135 47 38 68 123 54 82 102 Drink tea (a) How many of the students drink exactly two of the three drinks? X students (b) How many of the students don't drink coffee? students (c) How many of the students drink neither tea nor soda, but do drink coffee? students
Step by Step Solution
There are 3 Steps involved in it

Get step-by-step solutions from verified subject matter experts