

Question: Settings updated US TREASURY ACTIVES CURV Actions 90 Table Export Settings Y X-Axis Tenor- Y-Axis Mid YTM Currency None PCS BGN Specific MM/DD/YY Relative Last
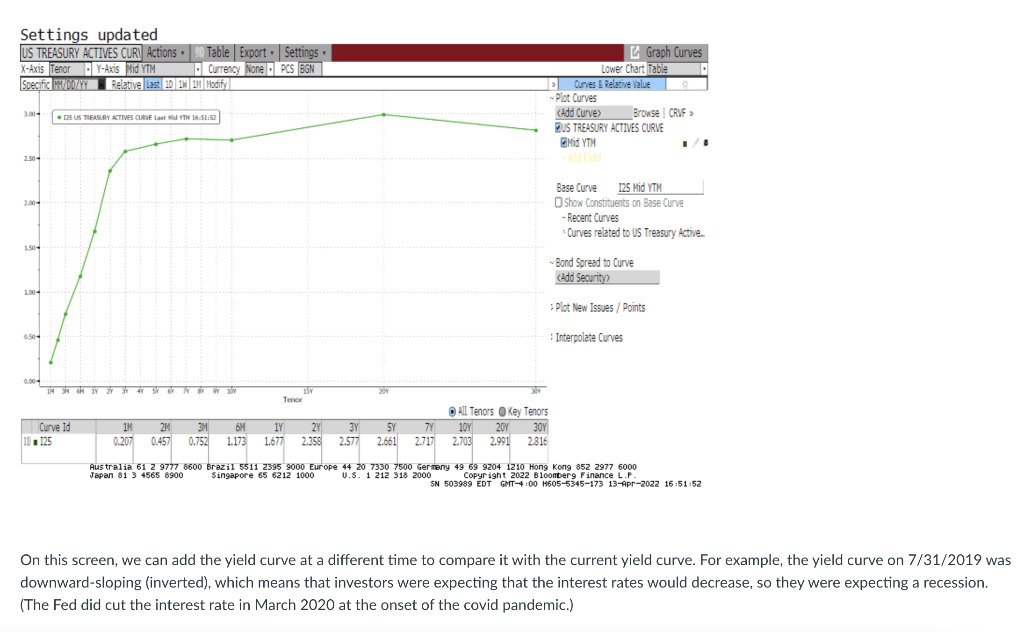

Settings updated US TREASURY ACTIVES CURV Actions 90 Table Export Settings Y X-Axis Tenor- Y-Axis Mid YTM Currency None PCS BGN Specific MM/DD/YY Relative Last 10 1W 1M Modify | | 3.00- 125 US TREASURY ACTIVES CURVE Last Mid YTH 16:51:52 2.50- 2.00- 1.50- 1.00- 0.50- 0.00- SV 6 7 8 9 S 14SH GHIY 2431 Graph Curves 41 Lower Chart Table Plot Curves
Step by Step Solution
There are 3 Steps involved in it

Get step-by-step solutions from verified subject matter experts