

Question: Setup your Python program file 'lab6A.py' Open a new, blank Python program window. At the top of the file, (and without indenting), enter the
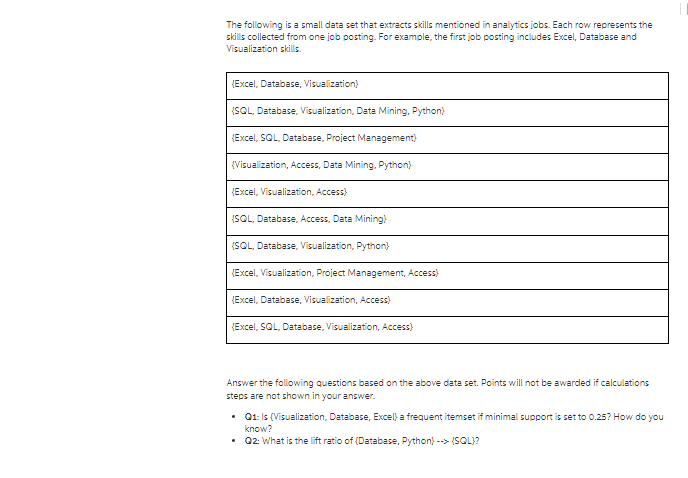
Setup your Python program file 'lab6A.py' Open a new, blank Python program window. At the top of the file, (and without indenting), enter the following command and comments from graphics import * # lab6A.py # (insert your name here} # This program animates a blue square in a 500 x 500 graphics window #23 It will terminate if a click is detected in the window # Full documentation of the Graphics module can be found at: # http://mcsp.wartburg.edu/zelle/python/graphics/graphics.pdf Create a Graphics window and blue square Write a Python function that creates a 500 x 500 graphics window, then creates and draws a 30x30 blue square in the center of the graphics window. Animate the blue square until mouse click Within your function, use a While loop to move the blue square vertically in the Graphics window in increments of 5 pixels until it reaches the edge (either top or bottom), then reverse its direction of movement. HINT: Use the move (dx, dy) function, then check the current location to decide if you should modify the dy parameter prior to moving the blue square again. The end condition for the While loop is if a mouse click is detected in the Graphics window - use the checkMouse () function. Close the Graphics Window It is important that you close the graphics window at the end of your program. Leaving them open clutters up your display and can cause your computer to hang or perform slowly. Add the following command to your function to close the window. win.close() # close win graphics window The following is a small data set that extracts skills mentioned in analytics jobs. Each row represents the skills collected from one job posting. For example, the first job posting includes Excel, Database and Visualization skills. (Excel, Database, Visualization) {SQL, Database, Visualization, Data Mining, Python) (Excel, SQL, Database, Project Management) {Visualization, Access, Data Mining, Python) (Excel, Visualization, Access) {SQL, Database, Access, Data Mining) (SQL, Database, Visualization, Python} (Excel, Visualization, Project Management, Access) (Excel, Database, Visualization, Access) (Excel, SQL, Database, Visualization, Access) Answer the following questions based on the above data set. Points will not be awarded if calculations steps are not shown in your answer. Q1: Is (Visualization, Database, Excel) a frequent itemset if minimal support is set to 0.25? How do you know? Q2: What is the lift ratio of (Database, Python) --> {SQL}?
Step by Step Solution
There are 3 Steps involved in it

Get step-by-step solutions from verified subject matter experts