

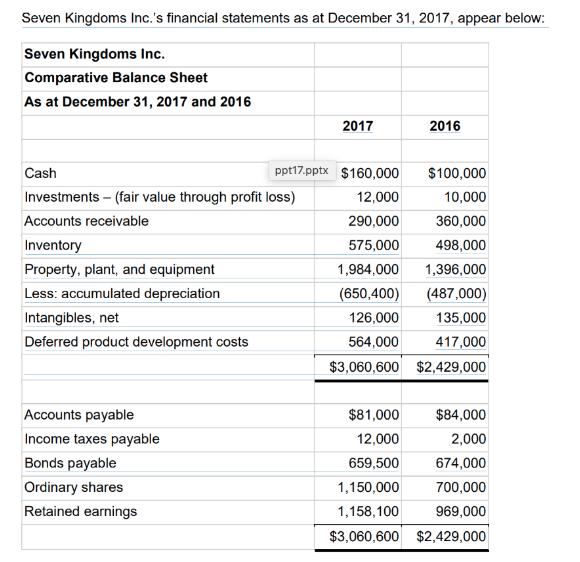
Seven Kingdoms Inc.'s financial statements as at December 31, 2017, appear below: Seven Kingdoms Inc. Comparative...
Fantastic news! We've Found the answer you've been seeking!
Question:
Transcribed Image Text:
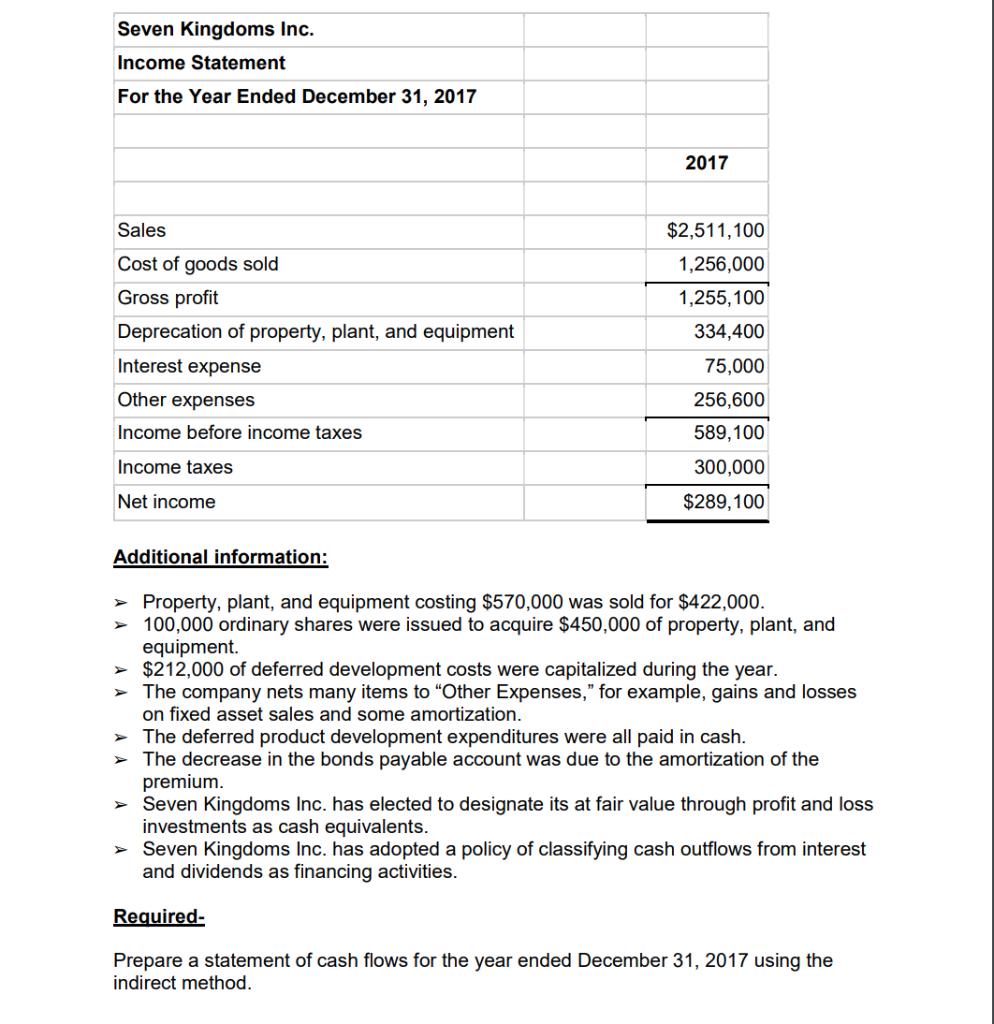
Seven Kingdoms Inc.'s financial statements as at December 31, 2017, appear below: Seven Kingdoms Inc. Comparative Balance Sheet As at December 31, 2017 and 2016 Cash Investments - (fair value through profit loss) Accounts receivable Inventory Property, plant, and equipment Less: accumulated depreciation Intangibles, net Deferred product development costs Accounts payable Income taxes payable Bonds payable Ordinary shares Retained earnings 2017 ppt17.pptx $160,000 12,000 290,000 575,000 2016 $100,000 10,000 360,000 498,000 1,984,000 1,396,000 (650,400) (487,000) 126,000 135,000 564,000 417,000 $3,060,600 $2,429,000 $81,000 12,000 659,500 1,150,000 1,158,100 $3,060,600 $2,429,000 $84,000 2,000 674,000 700,000 969,000 Seven Kingdoms Inc. Income Statement For the Year Ended December 31, 2017 Sales Cost of goods sold Gross profit Deprecation of property, plant, and equipment Interest expense Other expenses Income before income taxes Income taxes Net income Additional information: 2017 $2,511,100 1,256,000 1,255,100 334,400 75,000 256,600 589,100 300,000 $289,100 > Property, plant, and equipment costing $570,000 was sold for $422,000. > 100,000 ordinary shares were issued to acquire $450,000 of property, plant, and equipment. > $212,000 of deferred development costs were capitalized during the year. The company nets many items to "Other Expenses," for example, gains and losses on fixed asset sales and some amortization. The deferred product development expenditures were all paid in cash. > The decrease in the bonds payable account was due to the amortization of the premium. > Seven Kingdoms Inc. has elected to designate its at fair value through profit and loss investments as cash equivalents. > Seven Kingdoms Inc. has adopted a policy of classifying cash outflows from interest and dividends as financing activities. Required- Prepare a statement of cash flows for the year ended December 31, 2017 using the indirect method. Seven Kingdoms Inc.'s financial statements as at December 31, 2017, appear below: Seven Kingdoms Inc. Comparative Balance Sheet As at December 31, 2017 and 2016 Cash Investments - (fair value through profit loss) Accounts receivable Inventory Property, plant, and equipment Less: accumulated depreciation Intangibles, net Deferred product development costs Accounts payable Income taxes payable Bonds payable Ordinary shares Retained earnings 2017 ppt17.pptx $160,000 12,000 290,000 575,000 2016 $100,000 10,000 360,000 498,000 1,984,000 1,396,000 (650,400) (487,000) 126,000 135,000 564,000 417,000 $3,060,600 $2,429,000 $81,000 12,000 659,500 1,150,000 1,158,100 $3,060,600 $2,429,000 $84,000 2,000 674,000 700,000 969,000 Seven Kingdoms Inc. Income Statement For the Year Ended December 31, 2017 Sales Cost of goods sold Gross profit Deprecation of property, plant, and equipment Interest expense Other expenses Income before income taxes Income taxes Net income Additional information: 2017 $2,511,100 1,256,000 1,255,100 334,400 75,000 256,600 589,100 300,000 $289,100 > Property, plant, and equipment costing $570,000 was sold for $422,000. > 100,000 ordinary shares were issued to acquire $450,000 of property, plant, and equipment. > $212,000 of deferred development costs were capitalized during the year. The company nets many items to "Other Expenses," for example, gains and losses on fixed asset sales and some amortization. The deferred product development expenditures were all paid in cash. > The decrease in the bonds payable account was due to the amortization of the premium. > Seven Kingdoms Inc. has elected to designate its at fair value through profit and loss investments as cash equivalents. > Seven Kingdoms Inc. has adopted a policy of classifying cash outflows from interest and dividends as financing activities. Required- Prepare a statement of cash flows for the year ended December 31, 2017 using the indirect method. Seven Kingdoms Inc.'s financial statements as at December 31, 2017, appear below: Seven Kingdoms Inc. Comparative Balance Sheet As at December 31, 2017 and 2016 Cash Investments - (fair value through profit loss) Accounts receivable Inventory Property, plant, and equipment Less: accumulated depreciation Intangibles, net Deferred product development costs Accounts payable Income taxes payable Bonds payable Ordinary shares Retained earnings 2017 ppt17.pptx $160,000 12,000 290,000 575,000 2016 $100,000 10,000 360,000 498,000 1,984,000 1,396,000 (650,400) (487,000) 126,000 135,000 564,000 417,000 $3,060,600 $2,429,000 $81,000 12,000 659,500 1,150,000 1,158,100 $3,060,600 $2,429,000 $84,000 2,000 674,000 700,000 969,000 Seven Kingdoms Inc. Income Statement For the Year Ended December 31, 2017 Sales Cost of goods sold Gross profit Deprecation of property, plant, and equipment Interest expense Other expenses Income before income taxes Income taxes Net income Additional information: 2017 $2,511,100 1,256,000 1,255,100 334,400 75,000 256,600 589,100 300,000 $289,100 > Property, plant, and equipment costing $570,000 was sold for $422,000. > 100,000 ordinary shares were issued to acquire $450,000 of property, plant, and equipment. > $212,000 of deferred development costs were capitalized during the year. The company nets many items to "Other Expenses," for example, gains and losses on fixed asset sales and some amortization. The deferred product development expenditures were all paid in cash. > The decrease in the bonds payable account was due to the amortization of the premium. > Seven Kingdoms Inc. has elected to designate its at fair value through profit and loss investments as cash equivalents. > Seven Kingdoms Inc. has adopted a policy of classifying cash outflows from interest and dividends as financing activities. Required- Prepare a statement of cash flows for the year ended December 31, 2017 using the indirect method. Seven Kingdoms Inc.'s financial statements as at December 31, 2017, appear below: Seven Kingdoms Inc. Comparative Balance Sheet As at December 31, 2017 and 2016 Cash Investments - (fair value through profit loss) Accounts receivable Inventory Property, plant, and equipment Less: accumulated depreciation Intangibles, net Deferred product development costs Accounts payable Income taxes payable Bonds payable Ordinary shares Retained earnings 2017 ppt17.pptx $160,000 12,000 290,000 575,000 2016 $100,000 10,000 360,000 498,000 1,984,000 1,396,000 (650,400) (487,000) 126,000 135,000 564,000 417,000 $3,060,600 $2,429,000 $81,000 12,000 659,500 1,150,000 1,158,100 $3,060,600 $2,429,000 $84,000 2,000 674,000 700,000 969,000 Seven Kingdoms Inc. Income Statement For the Year Ended December 31, 2017 Sales Cost of goods sold Gross profit Deprecation of property, plant, and equipment Interest expense Other expenses Income before income taxes Income taxes Net income Additional information: 2017 $2,511,100 1,256,000 1,255,100 334,400 75,000 256,600 589,100 300,000 $289,100 > Property, plant, and equipment costing $570,000 was sold for $422,000. > 100,000 ordinary shares were issued to acquire $450,000 of property, plant, and equipment. > $212,000 of deferred development costs were capitalized during the year. The company nets many items to "Other Expenses," for example, gains and losses on fixed asset sales and some amortization. The deferred product development expenditures were all paid in cash. > The decrease in the bonds payable account was due to the amortization of the premium. > Seven Kingdoms Inc. has elected to designate its at fair value through profit and loss investments as cash equivalents. > Seven Kingdoms Inc. has adopted a policy of classifying cash outflows from interest and dividends as financing activities. Required- Prepare a statement of cash flows for the year ended December 31, 2017 using the indirect method. Seven Kingdoms Inc.'s financial statements as at December 31, 2017, appear below: Seven Kingdoms Inc. Comparative Balance Sheet As at December 31, 2017 and 2016 Cash Investments - (fair value through profit loss) Accounts receivable Inventory Property, plant, and equipment Less: accumulated depreciation Intangibles, net Deferred product development costs Accounts payable Income taxes payable Bonds payable Ordinary shares Retained earnings 2017 ppt17.pptx $160,000 12,000 290,000 575,000 2016 $100,000 10,000 360,000 498,000 1,984,000 1,396,000 (650,400) (487,000) 126,000 135,000 564,000 417,000 $3,060,600 $2,429,000 $81,000 12,000 659,500 1,150,000 1,158,100 $3,060,600 $2,429,000 $84,000 2,000 674,000 700,000 969,000 Seven Kingdoms Inc. Income Statement For the Year Ended December 31, 2017 Sales Cost of goods sold Gross profit Deprecation of property, plant, and equipment Interest expense Other expenses Income before income taxes Income taxes Net income Additional information: 2017 $2,511,100 1,256,000 1,255,100 334,400 75,000 256,600 589,100 300,000 $289,100 > Property, plant, and equipment costing $570,000 was sold for $422,000. > 100,000 ordinary shares were issued to acquire $450,000 of property, plant, and equipment. > $212,000 of deferred development costs were capitalized during the year. The company nets many items to "Other Expenses," for example, gains and losses on fixed asset sales and some amortization. The deferred product development expenditures were all paid in cash. > The decrease in the bonds payable account was due to the amortization of the premium. > Seven Kingdoms Inc. has elected to designate its at fair value through profit and loss investments as cash equivalents. > Seven Kingdoms Inc. has adopted a policy of classifying cash outflows from interest and dividends as financing activities. Required- Prepare a statement of cash flows for the year ended December 31, 2017 using the indirect method. Seven Kingdoms Inc.'s financial statements as at December 31, 2017, appear below: Seven Kingdoms Inc. Comparative Balance Sheet As at December 31, 2017 and 2016 Cash Investments - (fair value through profit loss) Accounts receivable Inventory Property, plant, and equipment Less: accumulated depreciation Intangibles, net Deferred product development costs Accounts payable Income taxes payable Bonds payable Ordinary shares Retained earnings 2017 ppt17.pptx $160,000 12,000 290,000 575,000 2016 $100,000 10,000 360,000 498,000 1,984,000 1,396,000 (650,400) (487,000) 126,000 135,000 564,000 417,000 $3,060,600 $2,429,000 $81,000 12,000 659,500 1,150,000 1,158,100 $3,060,600 $2,429,000 $84,000 2,000 674,000 700,000 969,000 Seven Kingdoms Inc. Income Statement For the Year Ended December 31, 2017 Sales Cost of goods sold Gross profit Deprecation of property, plant, and equipment Interest expense Other expenses Income before income taxes Income taxes Net income Additional information: 2017 $2,511,100 1,256,000 1,255,100 334,400 75,000 256,600 589,100 300,000 $289,100 > Property, plant, and equipment costing $570,000 was sold for $422,000. > 100,000 ordinary shares were issued to acquire $450,000 of property, plant, and equipment. > $212,000 of deferred development costs were capitalized during the year. The company nets many items to "Other Expenses," for example, gains and losses on fixed asset sales and some amortization. The deferred product development expenditures were all paid in cash. > The decrease in the bonds payable account was due to the amortization of the premium. > Seven Kingdoms Inc. has elected to designate its at fair value through profit and loss investments as cash equivalents. > Seven Kingdoms Inc. has adopted a policy of classifying cash outflows from interest and dividends as financing activities. Required- Prepare a statement of cash flows for the year ended December 31, 2017 using the indirect method. Seven Kingdoms Inc.'s financial statements as at December 31, 2017, appear below: Seven Kingdoms Inc. Comparative Balance Sheet As at December 31, 2017 and 2016 Cash Investments - (fair value through profit loss) Accounts receivable Inventory Property, plant, and equipment Less: accumulated depreciation Intangibles, net Deferred product development costs Accounts payable Income taxes payable Bonds payable Ordinary shares Retained earnings 2017 ppt17.pptx $160,000 12,000 290,000 575,000 2016 $100,000 10,000 360,000 498,000 1,984,000 1,396,000 (650,400) (487,000) 126,000 135,000 564,000 417,000 $3,060,600 $2,429,000 $81,000 12,000 659,500 1,150,000 1,158,100 $3,060,600 $2,429,000 $84,000 2,000 674,000 700,000 969,000 Seven Kingdoms Inc. Income Statement For the Year Ended December 31, 2017 Sales Cost of goods sold Gross profit Deprecation of property, plant, and equipment Interest expense Other expenses Income before income taxes Income taxes Net income Additional information: 2017 $2,511,100 1,256,000 1,255,100 334,400 75,000 256,600 589,100 300,000 $289,100 > Property, plant, and equipment costing $570,000 was sold for $422,000. > 100,000 ordinary shares were issued to acquire $450,000 of property, plant, and equipment. > $212,000 of deferred development costs were capitalized during the year. The company nets many items to "Other Expenses," for example, gains and losses on fixed asset sales and some amortization. The deferred product development expenditures were all paid in cash. > The decrease in the bonds payable account was due to the amortization of the premium. > Seven Kingdoms Inc. has elected to designate its at fair value through profit and loss investments as cash equivalents. > Seven Kingdoms Inc. has adopted a policy of classifying cash outflows from interest and dividends as financing activities. Required- Prepare a statement of cash flows for the year ended December 31, 2017 using the indirect method. Seven Kingdoms Inc.'s financial statements as at December 31, 2017, appear below: Seven Kingdoms Inc. Comparative Balance Sheet As at December 31, 2017 and 2016 Cash Investments - (fair value through profit loss) Accounts receivable Inventory Property, plant, and equipment Less: accumulated depreciation Intangibles, net Deferred product development costs Accounts payable Income taxes payable Bonds payable Ordinary shares Retained earnings 2017 ppt17.pptx $160,000 12,000 290,000 575,000 2016 $100,000 10,000 360,000 498,000 1,984,000 1,396,000 (650,400) (487,000) 126,000 135,000 564,000 417,000 $3,060,600 $2,429,000 $81,000 12,000 659,500 1,150,000 1,158,100 $3,060,600 $2,429,000 $84,000 2,000 674,000 700,000 969,000 Seven Kingdoms Inc. Income Statement For the Year Ended December 31, 2017 Sales Cost of goods sold Gross profit Deprecation of property, plant, and equipment Interest expense Other expenses Income before income taxes Income taxes Net income Additional information: 2017 $2,511,100 1,256,000 1,255,100 334,400 75,000 256,600 589,100 300,000 $289,100 > Property, plant, and equipment costing $570,000 was sold for $422,000. > 100,000 ordinary shares were issued to acquire $450,000 of property, plant, and equipment. > $212,000 of deferred development costs were capitalized during the year. The company nets many items to "Other Expenses," for example, gains and losses on fixed asset sales and some amortization. The deferred product development expenditures were all paid in cash. > The decrease in the bonds payable account was due to the amortization of the premium. > Seven Kingdoms Inc. has elected to designate its at fair value through profit and loss investments as cash equivalents. > Seven Kingdoms Inc. has adopted a policy of classifying cash outflows from interest and dividends as financing activities. Required- Prepare a statement of cash flows for the year ended December 31, 2017 using the indirect method.
Expert Answer:
Answer rating: 100% (QA)
Cash flow statement For the year ended 31 December 2017 Cash flow from operating activities Net income 289100 Adjustments to reconcile net income to n... View the full answer

Related Book For 
Posted Date:
Students also viewed these accounting questions
-
Ortega Corporation's income statement for the year ended June 30, 2011, and its comparative balance sheets as of June 30, 2011 and 2010, appear on the nest page. During 2011, the corporation sod at a...
-
Bronek Corporations income statement for the year ended June 30, 2011, and its comparative balance sheets as of June 30, 2011 and 2010 follow. During 2011, the corporation sold at a loss of $2,000...
-
Reed Corporations income statement for the year ended June 30, 2014, and its comparative balance sheets as of June 30, 2014 and 2013, follow. During 2014, the corporation sold at a loss of $8,000...
-
Once down to about 15, the worlds only wild flock of whooping cranes now numbers a record 237 birds in its Texas Coastal Bend wintering ground (www.SunHerald.com). The average whooping crane egg...
-
For 2013, Omaha Mechanical has a monthly over-head cost formula of $ 42,900 + $ 6 per direct labor hour. The firms 2013 expected annual capacity is 78,000 direct labor hours, to be incurred evenly...
-
Why do nations impose laws to restrict or facilitate international transactions?
-
During an audit of the financial statements of Custer-McClurg, Inc., Timothy Barnes, the engagement manager, requested and received a client prepared property and casualty insurance spreadsheet that...
-
Here are comparative balance sheets for Syal Company. Additional information:1. Net income for 2012 was $103,000.2. Cash dividends of $45,000 were declared and paid.3. Bonds payable amounting to...
-
One subunit of Speed Sports Company had the following financial results last month: (Click the icon to view the financial results.) Read the requirements. Requirement 1. Complete the performance...
-
David R. and Ella M. Cole (ages 39 and 38, respectively) are husband and wife who live at 1820 Elk Avenue, Denver, CO 80202. David is a self-employed consultant, specializing in retail management and...
-
Q2. A) Springs, Inc., has set up a licensing agreement with a manufacturer in the Czech Republic. When Springs receives orders for its products from customers in Eastern Europe, it relies on this...
-
object is a shared object that can be used in multiple contexts simultaneously. (a) Adaptor (b) Decorator (c) Fly Weight (d) Proxy
-
What is the most common use for the Adapter pattern? (a) Inheritance (b) Polymorphism (c) Encapsulation (d) Data hiding
-
Does the Faade pattern usually give you access to the entire system? (a) Yes (b) Partition of the system (c) Customized partition of the system based on the users needs (d) None of the above
-
Define a subsidiary company and explain the key elements of the definition.
-
For a system that has more number of services than the objects, which OOA technique may be suitable?
-
Three boilers have capacities of 200kr and 250kr. If 150, 000kg of coal are supplied to three boilers for 10 days. What is the capacity of the third boiler? A. 200kr C. 175k r B. 250k 9 D. 150k r
-
Kenneth Hubbard has prepared the following list of statements about managerial accounting and financial accounting. 1. Financial accounting focuses on providing information to internal users. 2....
-
On January 1, 2019, Dudas Inc. entered into a 12-month, non-renewable lease to rent office equipment. The lease payment is $1,500 per month first due on January 31, 2019. The interest rate implicit...
-
Sherbrook Pizza Inc. (SPI) was incorporated on January 1, 2018. Its capital structure included 5,000 ordinary shares; 1,000, $100, 4%, non-cumulative preferred shares; and 10,000 options on ordinary...
-
The following are selected details of Complex Capital Structures Inc.s capital structure as at January 1, 2018: 400,000 ordinary shares were issued; 200,000 were outstanding. Bonds A$2,000,000, 4%,...
-
With reference to Exercise 11.65, test the null hypothesis \(\beta=1.5\) against the alternative hypothesis \(\beta>1.5\) at the 0.01 level of significance. Data From Exercise 11.65 11.65 The data...
-
The data below pertains to the number of hours a laptop has been charged for and the number of hours of backup provided by the battery. (a) Use the first set of expressions on page 330, involving...
-
With reference to Exercise 11.65, construct a \(99 \%\) confidence interval for \(\alpha\).

Study smarter with the SolutionInn App