

Question: Several construction projects in Hong Kong have variable durations for completion which are normally distributed with a mean of 40 months, and a standard deviation


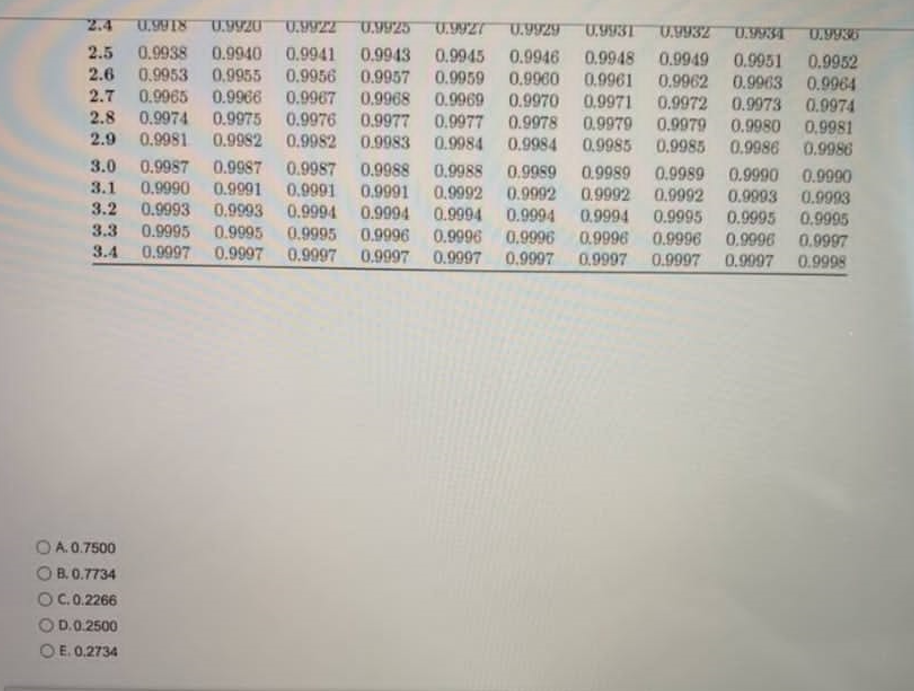

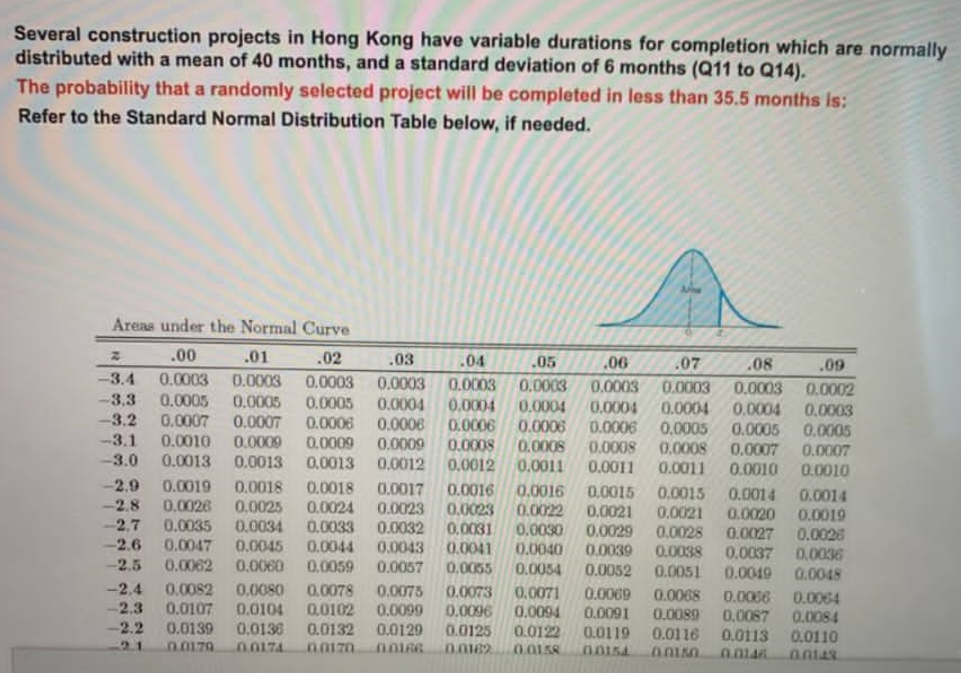
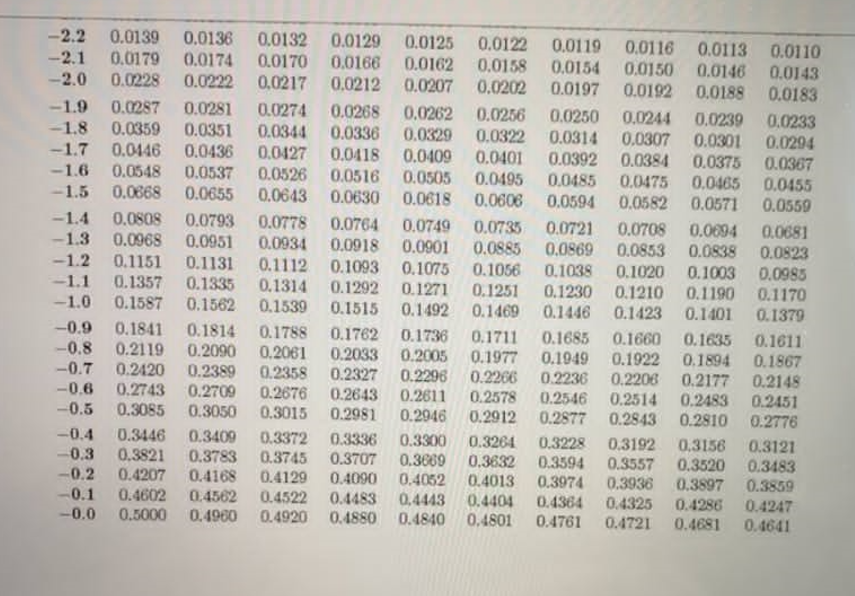
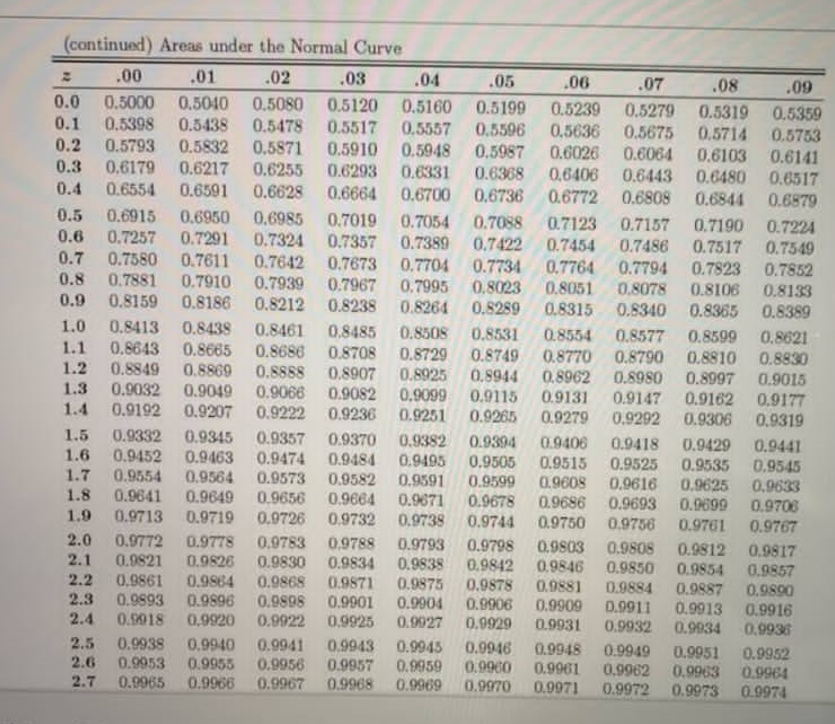

Several construction projects in Hong Kong have variable durations for completion which are normally distributed with a mean of 40 months, and a standard deviation of 6 months (Q11 to Q14). The probability that a randomly selected project will be completed in less than 35.5 months Is: Refer to the Standard Normal Distribution Table below, if needed. Areas under the Normal Curve z .00 .01 .02 .03 .05 .06 .07 .08 .09 -3.4 0,0003 0.0003 0.0003 0.0003 0.0003 0.0003 0.0003 0.0003 0,0003 0.0002 -3.3 0.0005 0.0005 0.0005 0.0004 0.0004 0.0004 0,0004 0.0004 0.0004 0.0003 -3.2 0.0007 0.0007 0.0006 0.0006 0.0006 0.0006 0.0006 0,0005 0.0005 0.0005 -3.1 0.0010 0:0009 0.0009 0.0009 0.0008 0.0008 0,0008 0.0008 0.0007 0.0007 -3.0 0.0013 0.0013 0.0013 0.0012 0,0012 0.0011 0.0011 0.0011 0.0010 0.0010 -2.9 0.0019 0.0018 0.0018 0.0017 0,0016 0.0016 0,0015 0.0015 0.0014 0.0014 -2.8 0.0026 0.0025 0.0024 0.0023 0.0023 0.0022 0,0021 0.0021 0.0020 0.0019 -2.7 0.0035 0.0034 0.0033 0.0032 0,0031 0,0030 0.0029 0.0028 0.0027 0.0026 -2.6 0.0047 0,0045 0.0044 0:0043 0.0041 0.0040 0.0039 0.0038 0.0037 0.0036 -2.5 0.0062 0.0060 0.0059 0.0057 0.0055 0.0054 0.0052 0,0051 0.0049 0.0045 -2.4 0.0082 0,0080 0.0078 0.0075 -0.0073 0.0071 0.0069 0.0038 D.0056 0.0064 -2.3 0.0107 0.0104 0,0102 0.0099 0.0096 0.0094 0.0091 0.0089 0.0087 0.0084 -2.2 0.0139 0.0136 0.0132 0.0129 0.0125 0.0122 0.0119 0.0116 0.0113 0.0110 40 0170 0.0182 0.0158 oniso\f(continued) Areas under the Normal Curve .00 .01 02 03 .04 .05 .06 07 .08 .09 0.0 0.5000 0.5040 0.5080 0.5120 0.5160 0.5199 0.5239 0.5279 0.5319 0.5359 0.1 0.5398 0.5438 0.5478 0.5517 0.5557 0.5596 0,5636 0.5675 0.5714 0.5753 0.2 0.5793 0.5832 0,5871 0.5910 0.5948 0.5987 0.6026 0.6064 0.6103 0.6141 0.3 0.6179 0.6217 0.6255 0.6293 0.6331 0.6368 0.6406 0.6443 0.6480 0.6517 0.4 0.6554 0.6591 0.6628 0.6664 0.6700 0.6736 0.6772 0.6808 0.6841 0.6879 0.5 0.6915 0.6950 0.6985 0.7019 0.7054 0.7088 0.7123 0.7157 0.7190 0.7224 0.6 0.7257 0.7291 0.7324 0.7357 0.7389 0.7422 0.7454 0.7486 0.7517 0.7549 0.7 0.7580 0.7611 0.7642 0.7673 0.7704 0.7734 0.7764 0.7794 0.7823 0.7852 0.8 0.7881 0.7910 0.7939 0.7967 0.7995 0.8023 0.8051 0.8078 0.8106 0.8133 0.9 0.8159 0.8186 0.8212 0.8238 0.8264 0.8289 0.8315 0.8340 0.8365 0.8389 1.0 0.8413 0.8438 0.8461 0.8485 0.8508 0,8531 0.8554 0.8577 0.8599 0.8621 1.1 0.8643 0.8665 0.8686 0.8708 0.8729 0.8749 0.8770 0.8790 0.8810 0.8830 1.2 0.8849 0.8869 0.8868 0.8907 0.8925 0.8944 0.8962 0.8980 0.8997 0.9015 1.3 0.9032 0.9049 0.9066 0.9082 0.9099 0.9115 0.9131 0.9147 0.9162 0.9177 1.4 0.9192 0.9207 0.9222 0.9236 0.9251 0.9265 0.9279 0.9292 0.9306 0.9319 1.5 0.9332 0.9345 0.9357 0.9370 0.9382 0.9394 0.9406 0.9418 0.9429 0.9441 1.6 0.9452 0.9463 0.9474 0.9484 0.9495 0,9505 0.9515 0.9525 0.9535 0.9545 1.7 0.9554 0.9564 0.9573 0.9582 0.9591 0.9599 0.9608 0.9616 0.9625 0,9633 1.8 0.9641 0.9649 0.9656 0.9664 0.9671 0.9678 0.9686 0.9693 0.9699 0.9706 1.9 0.9713 0.9719 0.9726 0.9732 0.9738 0.9744 0.9750 0.9756 0.9761 0.9767 2.0 0.9772 0.9778 0.9783 0.9788 0.9793 0.9798 0.9803 0.9808 0.9812 0.9817 2.1 0.9821 0.9826 10.9830 0.9834 0.9838 0.9842 0,9846 0.9850 0.9854 0.9857 2.2 0.9861 0.9884 0.9868 0.9871 0,9875 0.9878 0.9881 0.9884 0.9887 0,9800 2.3 0.9893 0.9896 0.9898 0.9901 0.9904 0.9906 0.9909 D.9911 0.9913 0.9916 2.4 0.9918 0.9920 0.9922 0,9925 0.9027 D.9929 0.9931 0.9932 0.9934 0.9936 2.5 0.9938 0.9940 0.9941 0.9943 0.9945 0.9946 0.9948 0.9949 0.9951 0.9952 2.6 0.9953 0.9955 0.9956 0.9957 0.9959 0,9960 0.9961 0,9962 0.9963 0.9964 2.7 0.9965 0.9966 0.9967 0.9968 0.9969 0.9970 0,9971 0.9972 0.9973 0.0974\fQUESTION 12 The probability that a randomly selected project will be completed within 40 and 44.5 months is: O A. 0.7734 O B. 0.2266 O C. 0.2734 O D. 0.7266 O E. None of the above QUESTION 13 The probability that a randomly selected project will be completed within 35.5 and 44.5 months is: O A. 0.7266 O B. 0.2266 O C. 0.5468 O D.0.2734 O E. None of the above
Step by Step Solution
There are 3 Steps involved in it

Get step-by-step solutions from verified subject matter experts